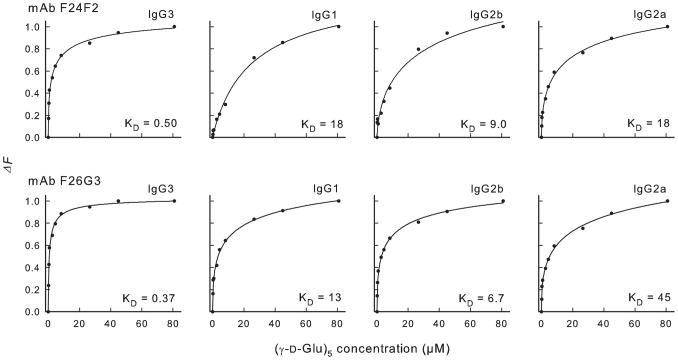
Figure 3. Assessment of binding of subclass switch families of mAbs F24F2 and F26G3 by fluorescence perturbation.
Changes in mAb fluorescence (excitation wavelength = 284 nm; emission wavelength = 341 nm) are reported for parental F24F2 or F26G3 IgG3 and subclass switch variants upon addition of increasing amounts of synthetic (γ-d-Glu)5. The solid lines are hyperbolic fits of the data to the equation: y = (axb)/(cb+xb), where c is the apparent dissociation constant (KD) in µM.

