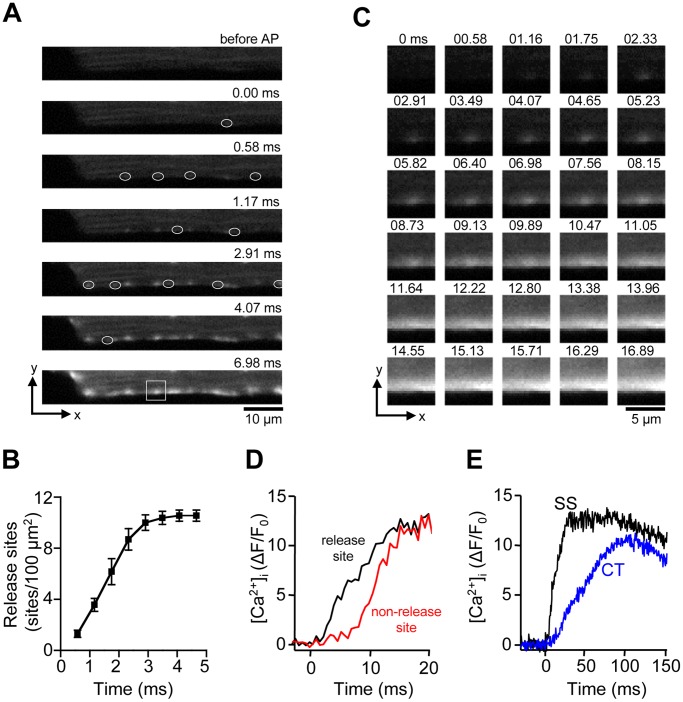
Figure 1. AP-induced Ca2+ transients in atrial myocytes.
A, series of confocal 2-D images of the early phase of a Ca2+ transient evoked by electrical field stimulation. White ovals mark the first appearance of individual Ca2+ release sites of the j-SR in the SS region. t = 0 indicates the image frame where the first activated CRU was detected. B, cumulative recruitment of individual j-SR CRUs. CRUs were detected in a SS region of 75 µm×2 µm and normalized to number of CRUs/100 µm2. C, Sequential 2-D images of an individual SS j-SR release site, marked by the white box in panel A, recorded at 0.58 ms time intervals. D, Evolution of [Ca2+]i at an individual SS CRU and an adjacent non-release site at a distance of ∼1 µm. The traces were recorded from a 1 pixel sized regions (0.09 µm2). E, comparison of SS (j-SR) and CT (nj-SR; recorded at a distance of ∼4 µm from the cell membrane) Ca2+ transients.

