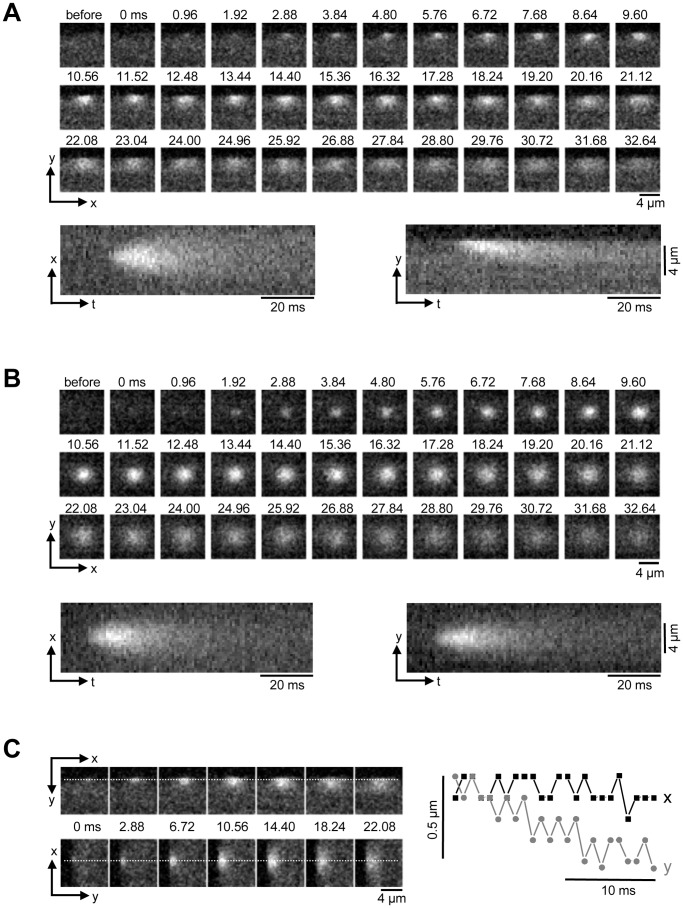
Figure 2. Ca2+ sparks in atrial myocytes.
A, Series of confocal 2-D images of a spontaneous Ca2+ spark originating from the SS j-SR, recorded at 0.96 ms intervals (top). Bottom: reconstructed line scan images (x-t and y-t) from the 2-D series. B, analogous to panel A: spontaneous Ca2+ spark recorded from a CT nj-SR Ca2+ release unit. C, movement of the x-y -coordinates of maximal fluorescence during a SS Ca2+ spark. Left: the spatial coordinates of peak fluorescence intensity were recorded along the dashed lines in x- and y-dimension. Right: x-t and y-t plots of the location of maximal fluorescence, indicating a preferential movement of the point source of Ca generating the spark in centripetal direction.

