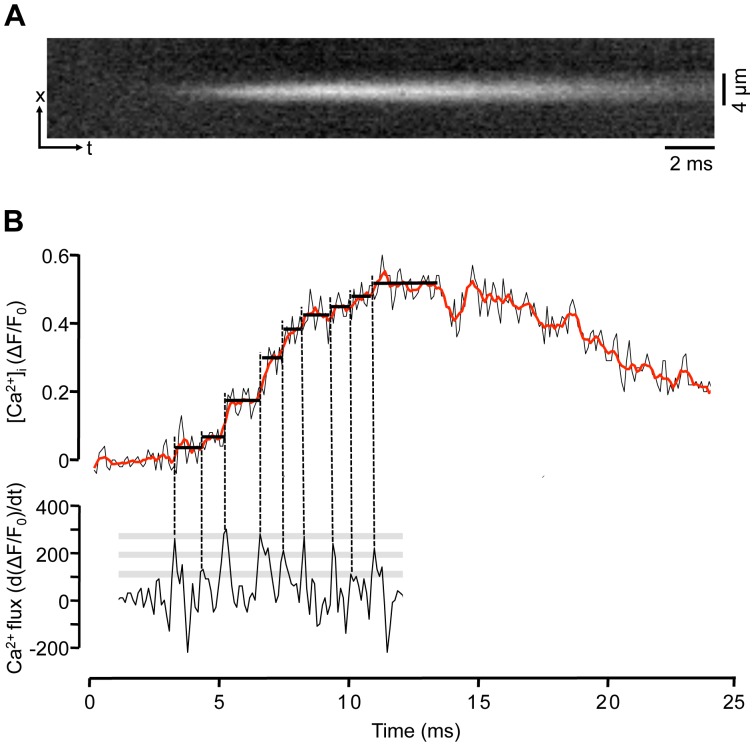
Figure 4. Ultra-fast Ca2+ spark recordings.
A, x-t line scan image recorded at 40,000 lines/s. B, Top: one pixel-wide (0.3 µm) ΔF/F0 profile recorded from the center of the spark. For noise reduction data were averaged to 10,000 lines/s. The red trace represents a 5-point moving average. Bottom: d(ΔF/F0)/dt (s−1), first derivative of the ΔF/F0 signal of the rising phase of the spark. Vertical dashed lines mark maxima of the d(ΔF/F0)/dt signal identifying maxima of Ca2+ release flux. The discrete peaks of the d(ΔF/F0)/dt signal were used to identify step-like increases of the ΔF/F0 signal (marked by horizontal solid black lines). Grey bars indicate discrete d(ΔF/F0)/dt levels. A discrete d(ΔF/F0)/dt level was defined when at least two d(ΔF/F0)/dt peaks of the same amplitude were observed.

