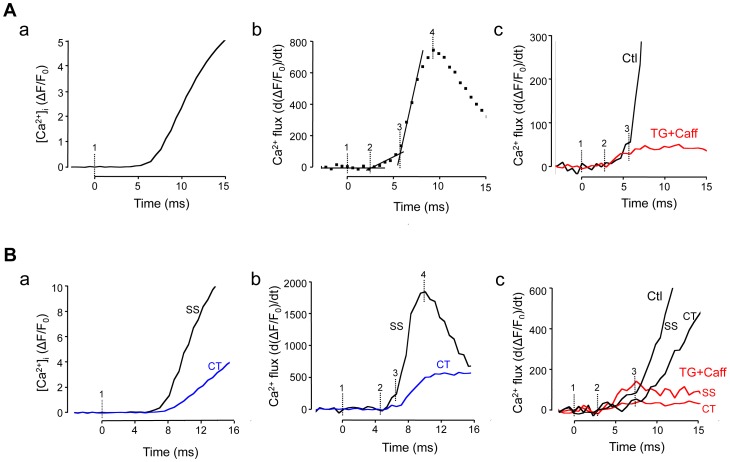
Figure 5. Subcellular Ca2+ fluxes during ECC identified by fast Ca2+ imaging.
A, global Ca2+ transient (ΔF/F0) elicited by electrical field stimulation of a ventricular myocyte (panel a). Marker ‘1’ indicates the application of the electrical stimulus. Markers ‘2’ and ‘3’ were positioned according to the analysis in panel b. Panel b: first derivative of ΔF/F0 (s−1) from panel a, representing Ca2+ flux. Markers ‘2’ and ‘3’ indicate abrupt changes in Ca2+ flux rate, and marker ‘4’ indicates maximal Ca2+ flux. Panel c: spatially averaged Ca2+ flux under control conditions (Ctl) and during inhibition of SR function with thapsigargin (TG; 1 µM) and caffeine (Caff; 10 mM). B, subcellular Ca2+ transients (ΔF/F0) elicited by electrical field stimulation and recorded from subsarcolemmal (SS) j-SR and central (CT) nj-SR regions of an atrial myocyte (panel a). Panel b: first derivative of SS and CT Ca2+ signals representing subcellular Ca2+ flux rates. Markers ‘1’ to ‘4’ as in panel A. Panel c: subcellular (SS, CT) Ca2+ flux rates in control and in the presence of thapsigargin+caffeine. 2-D images were recorded 1719 Hz time resolution.

