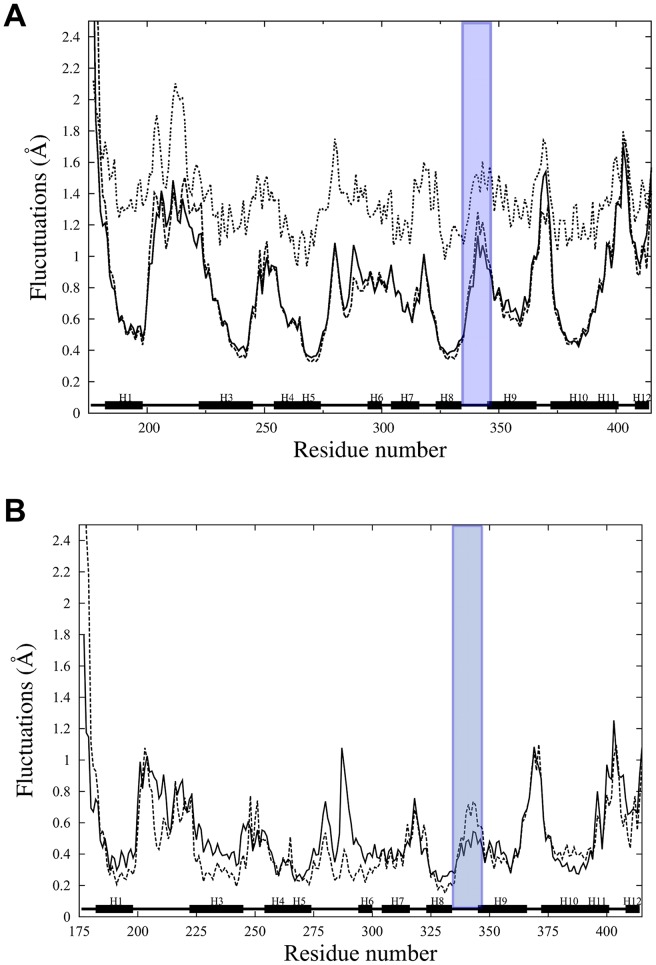
Figure 7. Backbone RMS fluctuations as a function of residue number calculated from the last 40 ns of the molecular dynamics simulations (A) and from the ten lowest frequency modes of the quasi-harmonic analysis (B).
Black lines correspond to the average over the three unphosphorylated RARα, dashed lines to the three phosphorylated RARα. In Figure 7.A, dotted lines correspond to the experimental B-factor values. Similar behavior is observed for the fluctuations calculated from simulations and the experimental values. The RMS fluctuations are averaged and displayed by residue. Fluctuations of loop L8–9 are highlighted in purple color.

