
Figure 4. Relative amounts of fungal DNA in rice roots at different time points (1, 3, 5, 7, 10, 15, 20, 25 and 30 d.a.i.).
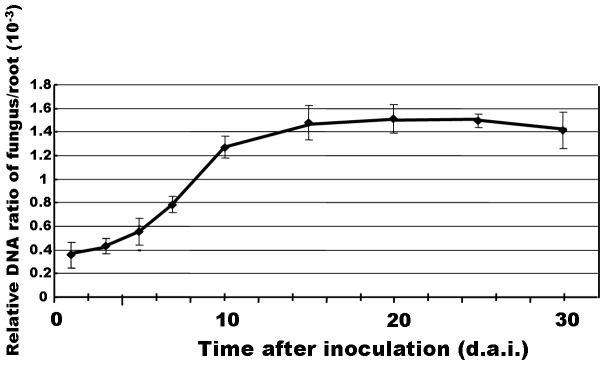
A fungal colonization curve plotted with the means ± SD of six replicates is shown.
Official websites use .gov
A
.gov website belongs to an official
government organization in the United States.
Secure .gov websites use HTTPS
A lock (
) or https:// means you've safely
connected to the .gov website. Share sensitive
information only on official, secure websites.
A fungal colonization curve plotted with the means ± SD of six replicates is shown.