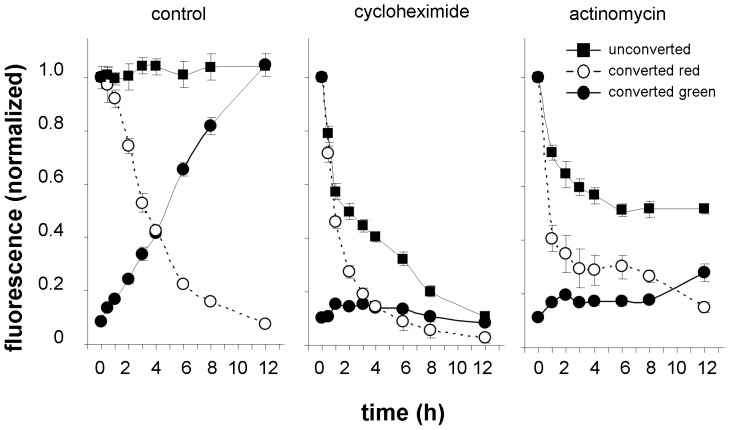
Figure 7. Cycloheximide (50 µM) and actinomycin A (50 µg ml−1) block PIN2 membrane delivery and accelerates PIN2 internalization.
The differences between control and samples treated by antibiotics were statistically highly significant (p≤0.001) when analyzed by the two-way ANOVA test in all events i.e. green and red signal intensities in photoconverting experiments and also in green signal intensity of unconverted samples. Bonferroni’s post test showed highly statistically significant differences (p≤0.001) between control and cycloheximide-treated seedlings at all time points for red signal intensities in photoconverting experiments and for green signal intensity in experiments with unconverted samples. Significant differences were observed in green signal intensity in photoconverting experiments at every time point from 2 to 12 h (for all p≤0.001). In the experiments with actinomycin A statistically significant differences between control and treated samples in red signal intensity were observed at every time point from 1 to 3 h (p≤0.001) and at time point 4 h (p≤0.05), in green signal intensity at time point 3 h (p≤0.01) and at every time point from 4 to 12 h (p≤0.001) and in green signal intensity of unconverted samples at all time points (p≤0.001). For others, the differences were statistically not significant.

