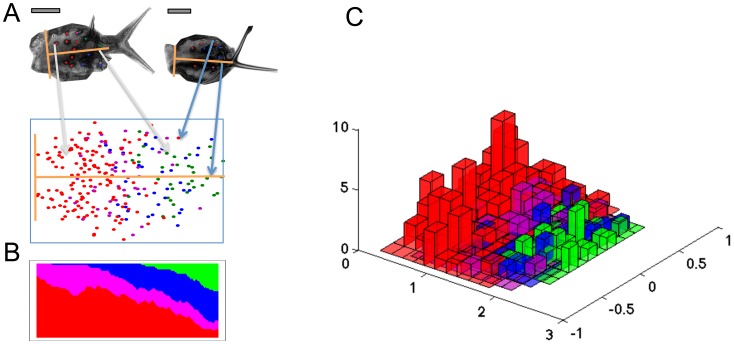
Figure 3. Meta leaf construction and analysis of spatial distribution of trichome classes for the Col-0 genotype.
A: The meta leaf is generated by transforming all trichomes of all leaves of a given genotype to a common coordinate system (yellow axes) as illustrated by two sample leaves. The origin of each leaf is defined manually, and the unit vector in longitudinal axis direction is defined by the center of mass of the leaf. The basal axis is perpendicular to the longitudinal axis. The meta leaf shows the distribution of different trichome classes across the leaf, where red (respectively magenta, blue, green) dots indicate initiation (respectively two branch-, three branch-, and mature trichomes). B: The trichome localization along the longitudinal leaf axis is visualized. The vertical axis shows the proportion of different trichome classes at a given distance from the origin. C: The distribution of trichome classes on the meta leaf surface is shown in a 3D histogram. Trichome numbers at each position are shown as bars. The colors for the trichome classes are chosen as in A. Scale bars 100 µm.

