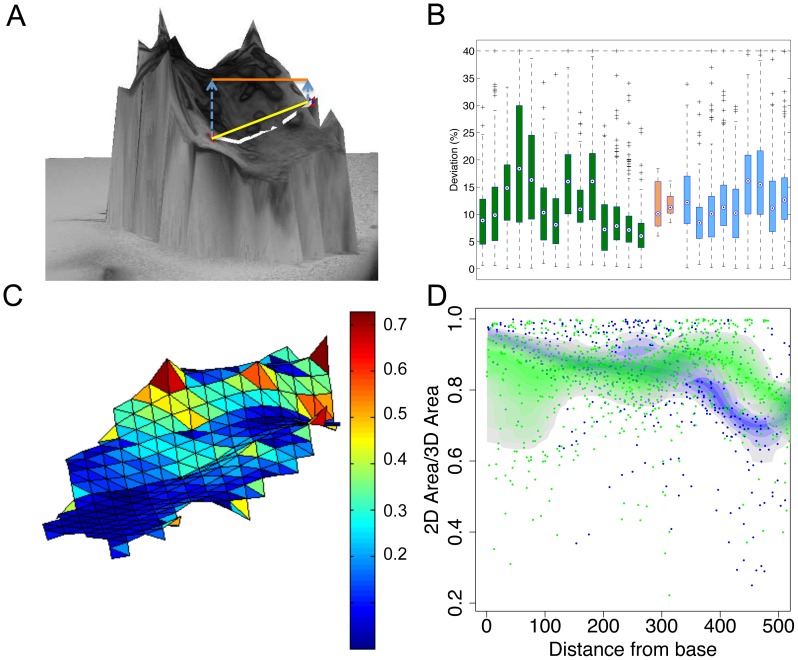
Figure 4. Comparison of Euclidean and geodesic distances.
A: 3D reconstruction of an A. thaliana leaf surface. The two red dots mark the origins of two trichomes. They illustrate the difference between geodesic distance (white line), Euclidean distance with 3D coordinates (yellow line) and 2D coordinates (orange line). B: Calculation of the 2D distance relative to the geodesic distance (2D distance in percent of geodesic distance). These relative values are summarized in box plots, one for each leaf (wild type in green, cpc-2 in blue). The orange boxes show the distribution of the median of these ratios for wild type (left) and cpc-2 mutants (right). C: Spatial distortion (2D area divided by 3D area) of the leaf surface. We calculate the distortion for each triangle of the elastic map. Triangles are color-coded by their distortion value. D: Diagram of the 2D to 3D ratios of the triangles along the longitudinal leaf axis (green: wild type, blue: cpc-2). The colored bands show the 50% confidence bands for each genotype. Scale bars 100 µm.

