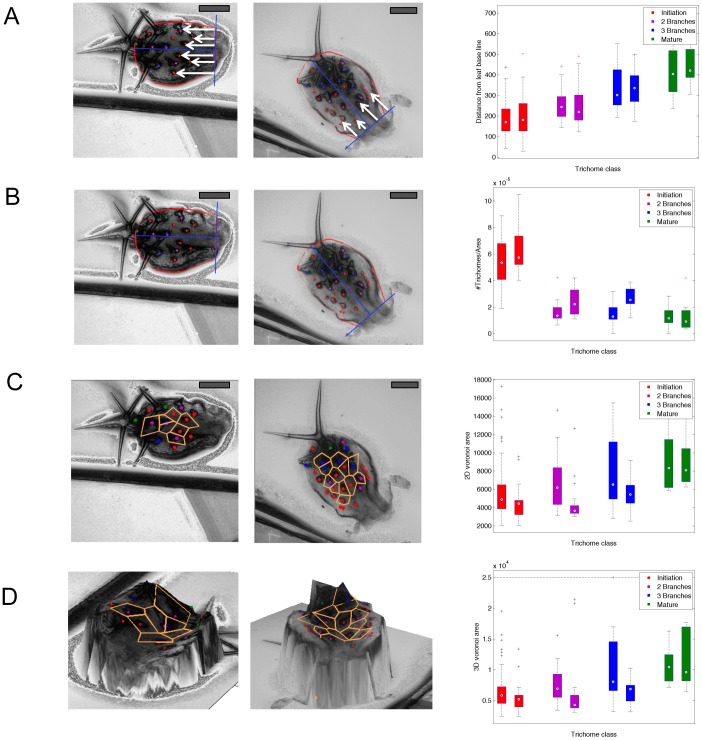
Figure 5. Analysis of trichome patterning by various spatial statistics.
Left panel: Example of a Col-0 leaf, middle panel: Example of a cpc-2 leaf, right panel: box plots of the statistics, stratified for trichome classes (red, magenta, blue, green) and genotypes (left box, right box). A: Distance from the leaf base line. B: Trichome density calculated as the number of trichomes divided by 3D leaf area. C: Voronoi areas of the trichomes defined by 2D Euclidean distance. D: Voronoi areas of the trichomes defined by 3D Euclidean distance. Scale bars 100 µm.

