
Figure 4. Acetylation of histone H3 decreases nucleosome stability.
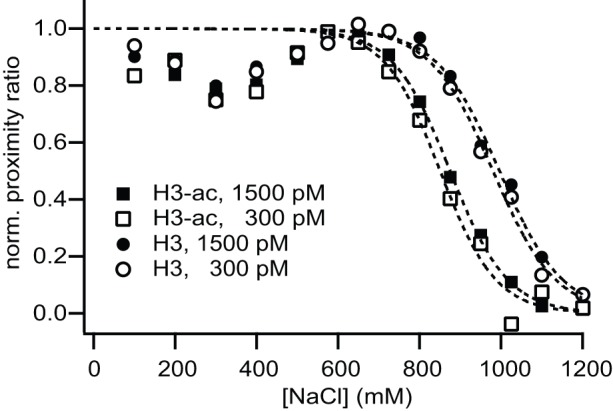
Salt-dependent proximity ratio at 1.5 nM and 300 pM nucleosome concentration measured with μpsFRET. A loss in P is interpreted as nucleosome dissociation. Salt titration curves were approximated by a sigmoidal function and nucleosome stability was quantified in terms of the c1/2 value, the salt concentration at which P is half the maximum observed around 500–600 mM NaCl. Measured c1/2 values were (995±20) mM and (980±15) mM for 1.5 nM and 300 pM non-acetylated nucleosomes, while measured c1/2-values were 120−130 mM lower for H3-acetylated nucleosomes ((875±10) mM and (850±20) mM for 1.5 nM and 300 pM).