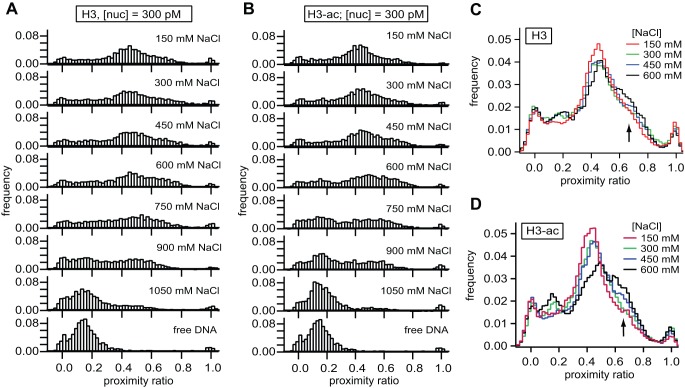
Figure 5. smFRET analysis reveals a conformational transition prior to nucleosome unwrapping.
A,B) smFRET histograms of non-acetylated and H3-acetylated nucleosomes at various salt concentrations and 300 pM total nucleosome concentration. Above 300 mM NaCl, a fraction of H3-acetylated nucleosomes populates a second conformation with slightly increased proximity ratio compared to non-acetylated nucleosomes, which appear to retain their initial structure. C, D) Overlay of histograms for salt concentrations between 150 mM and 600 mM NaCl for non-acetylated (C) and H3-acetylated nucleosomes (D). Data were smoothed once to better visualize the gradual transition of nucleosomes into the high FRET state.

