
Figure 6. smFRET results on nucleosome stability are consistent to μpsFRET data.
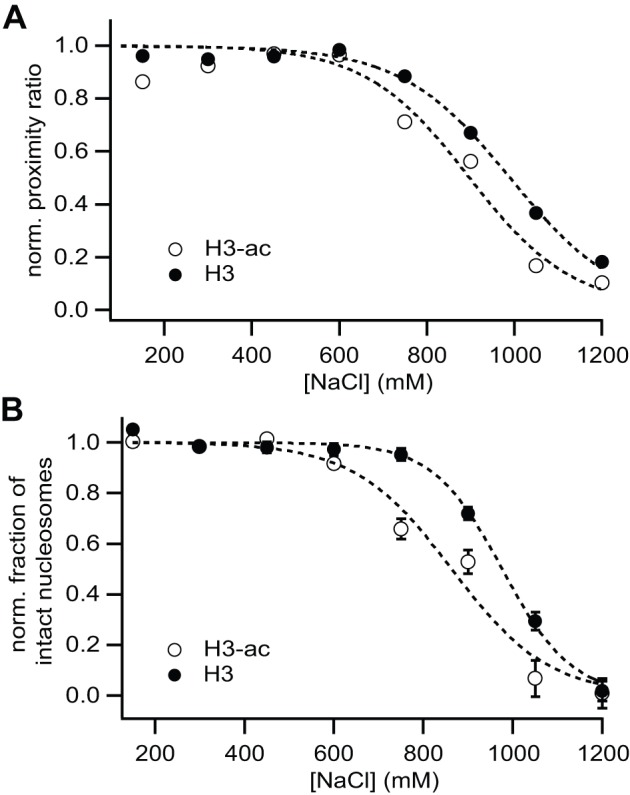
(A) Average proximity ratio calculated from all photons from double-labeled nucleosomes as a function of salt concentration. Photons from the donor and transfer channel were summed for all detected molecules, except donor-only and acceptor-only species. (B) Salt dependence of the fraction of intact nucleosomes in smFRET histograms from Fig. 5. For each histogram, the donor-only and acceptor-only population was excluded from the analysis. The relative fraction of FRET-active molecules (0.25<P<0.9) is plotted against salt concentration. Sigmoidal curves were approximated to the data to extract c1/2 values, which are listed in Table 1. After fitting data were normalized to better visualize the difference between non-acetylated and H3-acetylated nucleosomes.