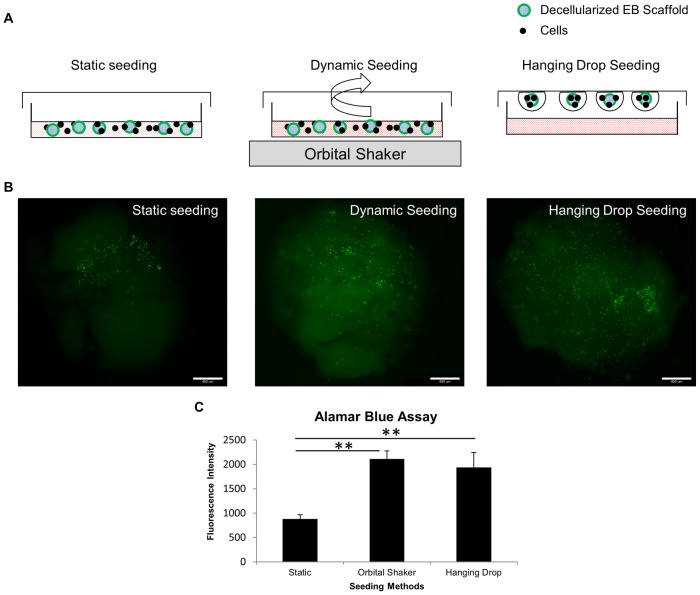
Figure 5. Analysis of seeding efficiency of EB scaffolds by three different seeding methods.
(A) Schematic illustration to demonstrate three different methods of cell seeding. (B) Whole mount fluorescence images of seeded EB scaffolds demonstrate three different seeding strategies on decellularized EB scaffolds examined at 6 hours after initial seeding. (C) Alamar Blue assay depicts higher seeding efficiency in both the orbital shaker and hanging drop seeding method than the static method. Bar = 450 µm. All values are mean ± SD, p<0.01 (**), n = 3, represents individual seeded EBs in 3 experimental repeats.

