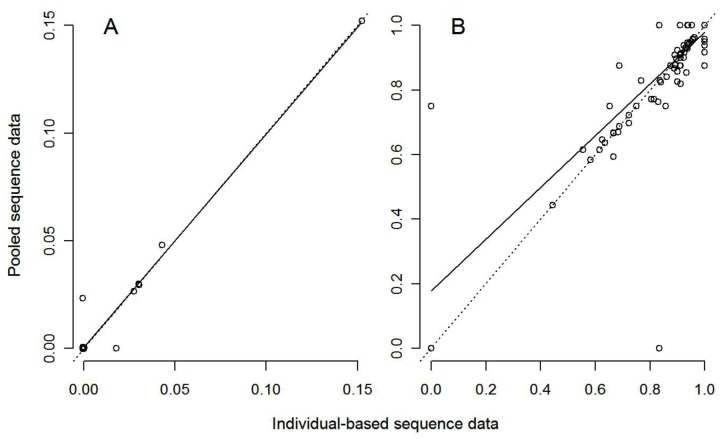
Figure 1. Relationship between pooled and individual approaches for estimating A) nucleotide diversity (π, N = 20 populations shown) and B) pairwise population differentiation (FST, N = 190 population-pairs shown) from Leiopelma hochstetteri 16S mtDNA data.
The dotted lines are the expected relationship where β = 1 (i.e. the two approaches give identical estimates), the solid lines are the observed linear regression (Table 1).

