
Figure 3. Users and GDP per capita.
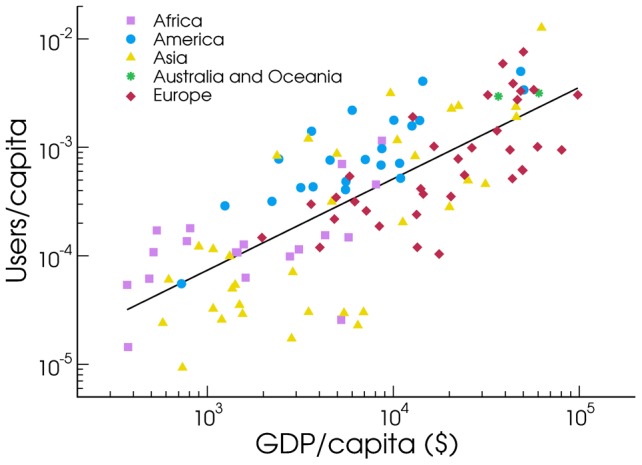
Correlation between country level Twitter penetration and GDP/capita. The adjusted R value of the fit is 0.56.
Official websites use .gov
A
.gov website belongs to an official
government organization in the United States.
Secure .gov websites use HTTPS
A lock (
) or https:// means you've safely
connected to the .gov website. Share sensitive
information only on official, secure websites.
Correlation between country level Twitter penetration and GDP/capita. The adjusted R value of the fit is 0.56.