
Figure 4. User Activity.
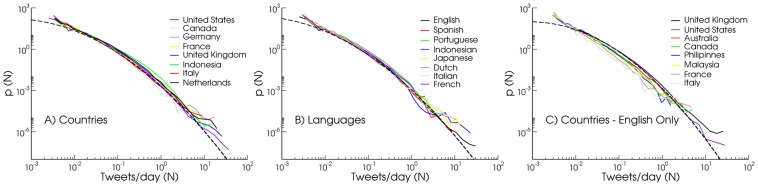
Probability density  of user activity (number of daily tweets N) grouped by country (A) and language (B), and by country while considering English tweets exclusively (C). Different curves collapse naturally, without any functional rescaling, indicating the presence of a seemingly universal distribution of users activity, independent from cultural backgrounds. Countries in panel (A) and (C) are characterized by high Twitter penetration and represent different continents, while the languages in panel (B) are selected from those producing very strong signal. Dashed lines represent log-normal distributions
  , with
  and
and  for (A),
  and
and  (B), and
  and
and  (C).
(C).