
Figure 6. Geographic distribution of languages around the world.
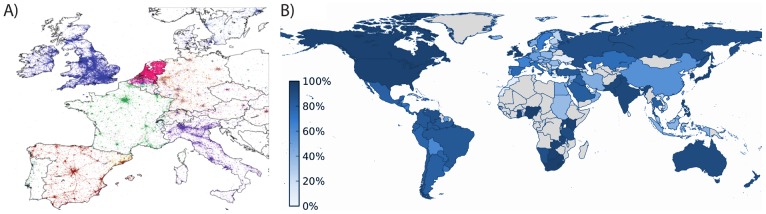
A) Raw Twitter signal. Each color corresponds to a language. Densely populated areas are easily identified, while, as expected, languages are well separated among European countries. B) Dominant language usage. The color of each country indicates the fraction of users adopting the official language in tweets. Gray represent countries without statistically significant signal.