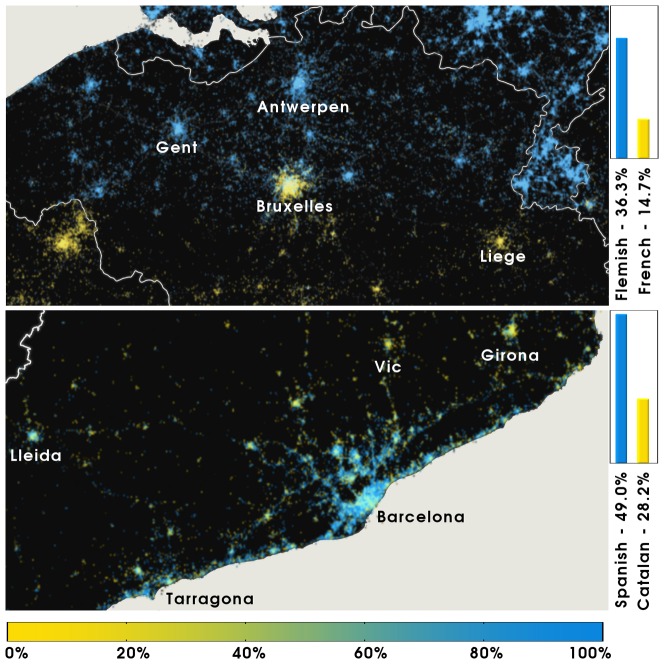
Figure 8. Language polarization in Belgium and Catalonia, Spain.
In each cell ( resolution) we compute the user-normalized ratio between the two languages being considered in each case. A) Belgium. B) Catalonia. The color bar is labeled according to the relative dominance of the language denoted by blue. In Belgium, English accounts for
  of the language share.

