
Figure 3. Refolding kinetics for selected CRABP1 variants.
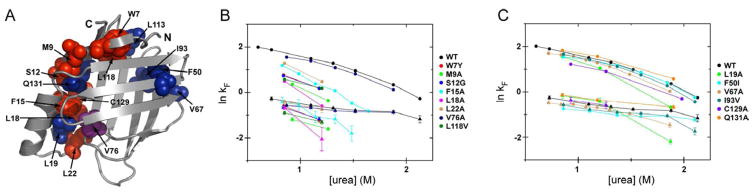
(A) CRABP1 variants used in refolding kinetics experiments are shown on the CRABP1 structure, with red spheres representing variants with φ-values > 0.5 and significant retardation of refolding kinetics, and blue spheres representing variants with φ-values < 0.5 and WT-like refolding behavior. V76A, which has a φ value of 0.74, but WT-like stopped-flow refolding, is shown in violet, and C129A, which perturbs the fast phase, is shown in red.
(B) Dependence of the logarithm of the rates of I2 and N formation (fast and medium kinetic phases) on [urea] at 25 °C for CRABP1 WT and selected variants with φ-values > 0.5. Shown are plots of ln kF vs. [urea] for the fast (in circles) and medium phases (in triangles).
(C) Same as panel (B) for the CRABP1 variants with φ-values < 0.5.
Colors correspond to those in Fig. 1A–D except for the C129A variant added in this figure.
See also Table S1.