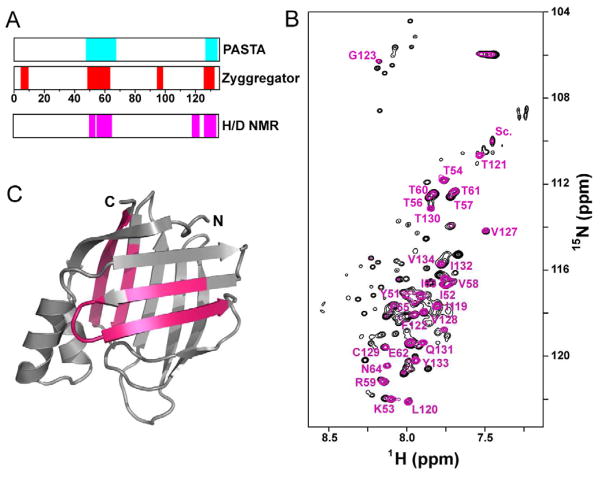
Figure 4. Predicted and experimentally identified aggregation-prone regions in CRABP1.
(A) Regions of CRABP1 predicted to be aggregation-prone by the Zyggregator (Tartaglia and Vendruscolo, 2008) and PASTA (Trovato et al., 2007) algorithms shown in red and cyan bars, respectively. Magenta bars indicate the actual aggregation cores determined by NMR.
(B) 1H-15N HSQC spectra of CRABP1 F71A aggregates dissolved in 95% d6-DMSO/5% D2O. Resonances in black correspond to unexchanged aggregates, while resonances in magenta correspond to aggregates that have been H/D-exchanged for four weeks. Peaks that retained significant intensity in the exchanged sample are identified.
(C) Regions of CRABP1 F71A found to be protected in the H/D exchange experiment (less than 50% drop in concentration-normalized peak intensity) are illustrated on the structure of CRABP1.
See also Figure S3.

