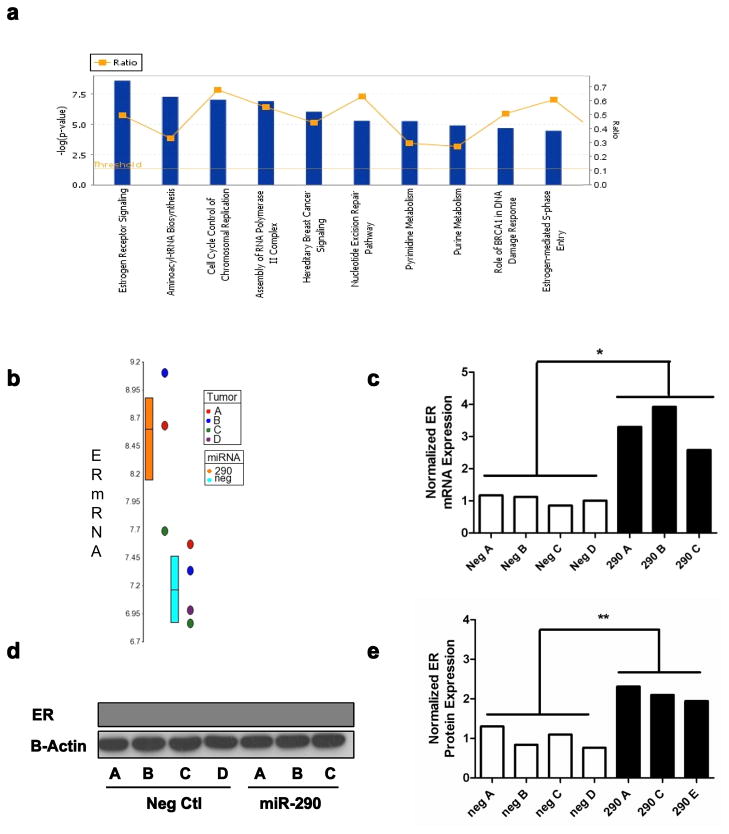
Fig. 4.
miR-290 enhances ER-alpha signaling and expression levels. a) The top ten canonical pathways dysregulated by miR-290. The blue bar represents p-value and the yellow squares represent the ratio of genes dysregulated in the pathway. ER mRNA levels were measured in the miR-290 tumors by b) microarray analysis and c) qRT-PCR. ER protein levels were detected in the miR-290 tumors by d) Western blot and e) quantified.

