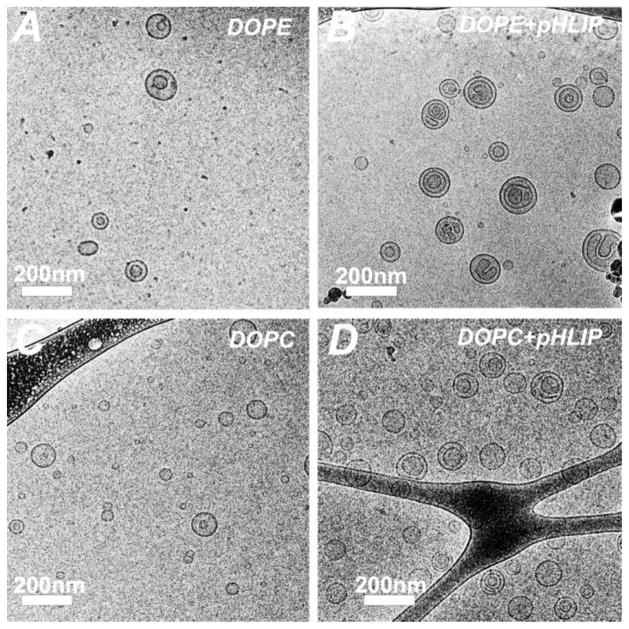
Figure 2. Cryo-TEM images of R18- labeled liposomes.
The control liposomes without pHLIP are shown on panels (A) (DOPE/DSPE- PEG2000/R18, 83:10:7) and (C) (DOPC/DSPE-PEG2000/R18, 83:10:7); and the pHLIP coated liposomes are shown on panels (B) (DOPE/DSPE- PEG2000/DSPE-PEG2000-pHLIP/R18, 83:5:5:7) and (D) (DOPC/DSPE- PEG2000/DSPE-PEG2000-pHLIP/R18, 83:5:5:7). The images were obtained using JEOL 2100 TEM with an accelerating voltage of 200 kV. The total lipid concentration of samples shown is 1 mM.

