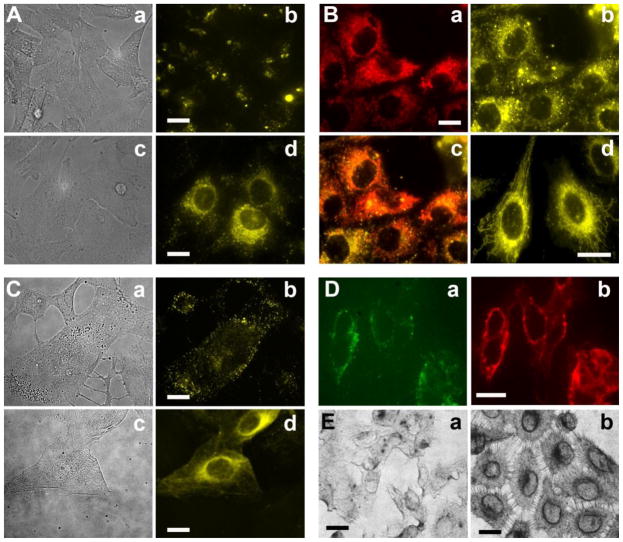
Figure 5. Cellular localization of liposomes.
(A) A549 cells in suspension were incubated with R18 DOPE liposomes with (c & d: ‘5:5’) or without pHLIP (a & b: ‘0:10’) in liposome coat in serum-free DMEM medium at pH 6.5 for 1 hr. The light (a, c) and fluorescent images (b, d) were taken 4 days after cell treatment with liposomes. (B) Mito-tracker fluorescent dye was used to stain mitochondria of cells treated with R18 DOPE liposomes containing pHLIP (a). pHLIP mediated uptake of R18 liposomes show specific staining of mitochondria (b). An overlay of (a) & (b) is shown in panel (c) to be certain that the staining pattern of R18 is truly due to mitochondrial localization. On the panel (d) a zoom-in picture of mitochondria stained with R18 liposome is shown. (C) Adherent A549 cells were treated with Rho-PE DOPE liposomes with (c & d: ‘5:5’ formulation) or without pHLIP (a & b: ‘0:10’) in PBS at pH 6.3 for 30 min. Both light (a, c) and fluorescent images (b, d) were taken immediately after washing. (D) Adherent A549 cells were treated with fluorescein DOPC liposomes with 5 mol % of pHLIP-PEG-lipids (PBS, pH 6.2, 1 hr). Staining of plasma membrane by FITC-lipids of liposomes shown on panel (a) is confirmed by staining of the plasma membrane of the same cells by Texas Red-labeled wheat germ agglutinin, as shown on panel (b). (E) Adherent A549 cells were treated with nanogold-containing DOPE liposomes with or without pHLIP in serum-free DMEM (pH 6.5, 15 min). After fixation and silver enhancement, cells were visualized under the light microscope (a: no pHLIP; b: with pHLIP). Liposomes containing 10 mol % of pHLIP delivered more nanogold to cells (image b) than control liposomes without pHLIP (image a). The scale bar is 20 μm in all images.

