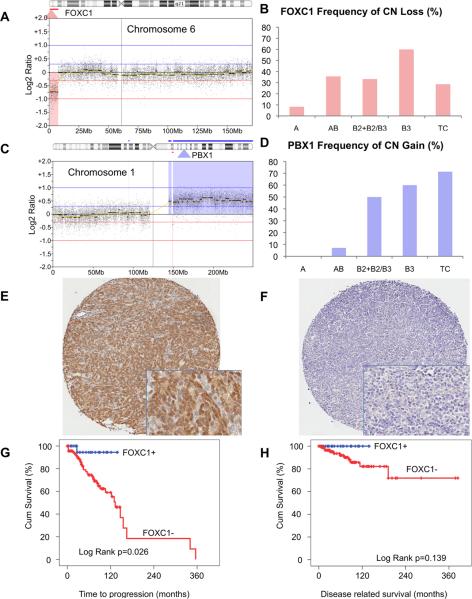
Figure 2. CN loss of FOXC1 and CN gain of PBX1 in thymic epithelial tumors and prognostic value of immunohistochemistry results.
(A) An example of a focal CN loss of chromosome 6p affecting FOXC1 locus. The map of chromosome 6 is reported horizontally, the red highlighted area indicates the region of CN loss. (B) Frequency of FOXC1 CN loss according to WHO histotypes. (C) A representative PBX1 CN gain along with CN gain of approximately the entire long arm of chromosome 1. (D) Frequency of PBX1 CN gain according to WHO histotypes. Examples of (E) FOXC1 positive G3 and (F) negative G0 staining. Kaplan-Maier curves for (G) time to progression and (H) disease related survival of patients with FOXC1 positive and negative tumors.

