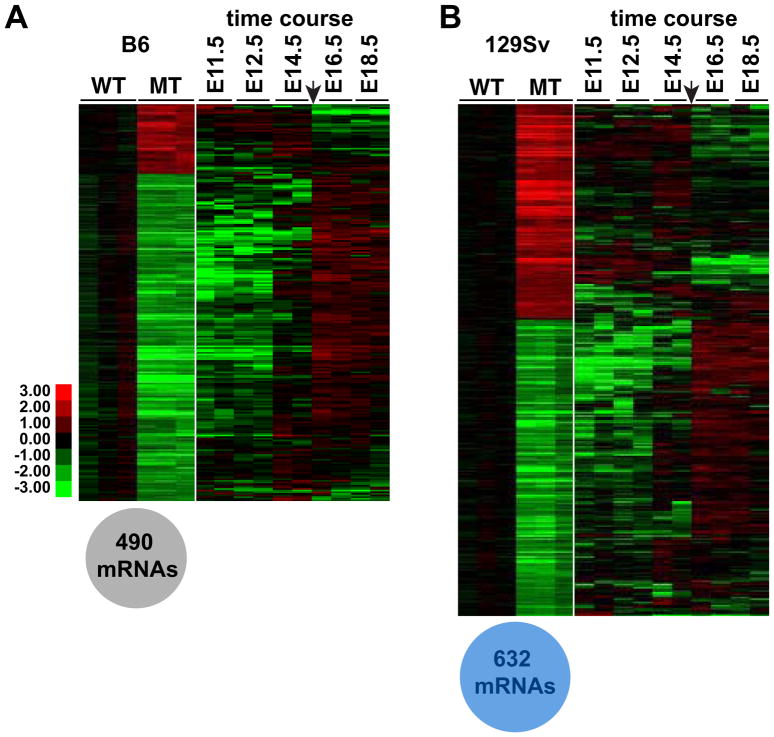
Figure 1. Misregulation of mRNA expression in B6 and 129Sv Dmrt1 mutant testes.
(A) Left: heat map showing relative expression of 490 mRNAs differing more than two-fold (P<0.05) between E15.5 B6 wild type and B6 Dmrt1 mutant testes. mRNA levels were normalized to wild type. Right: data from Small et al. (2005) showing relative expression of the same mRNAs from E11.5 to E18.5. Arrow indicates E15.5. (B) Left: heat map showing relative expression of 632 mRNAs that differed more than two-fold between E15.5 129Sv wild type and 129Sv Dmrt1 mutant testes. Right: data from Small et al. (2005) showing relative expression of the same mRNAs from E11.5 to E18.5 in B6/129 hybrid testes.

