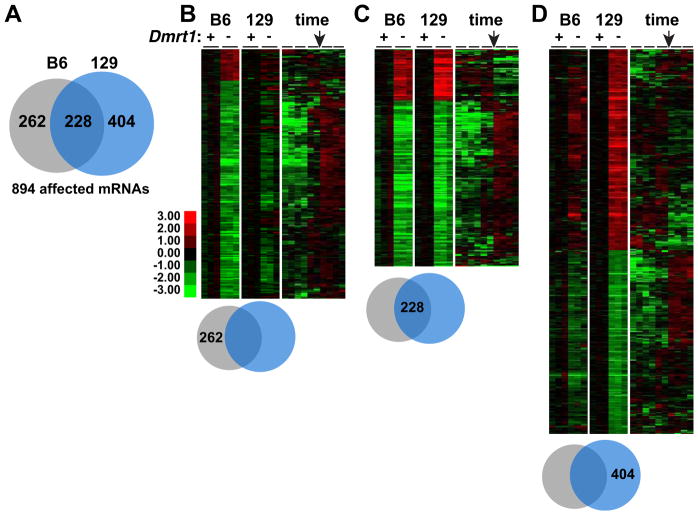
Figure 2. mRNA misexpression in Dmrt1 mutant testes is dependent on genetic background.
(A) Venn diagram indicating the proportion of 894 mRNAs misexpressed more than two-fold (P>0.05) in that were affected in Dmrt1 mutant testes of each genetic background. (B) Left: heat map showing relative expression of 262 mRNAs whose expression differed more than two-fold in B6 mutant testes and less than two-fold in 129Sv mutant testes at E15.5. Right: heat map using data of Small et al (2005) and showing relative expression of the same mRNAs from E11.5 to E18.5 in B6/129 hybrid testes. Arrow indicates E15.5. (C) As in panel B, but showing relative expression of 228 mRNAs affected more than two-fold in mutant testes of both strain backgrounds. (D) As in panel B but showing relative expression of 404 mRNAs affected more than two-fold in 129Sv mutant testes and less than two-fold in B6 mutant testes.

