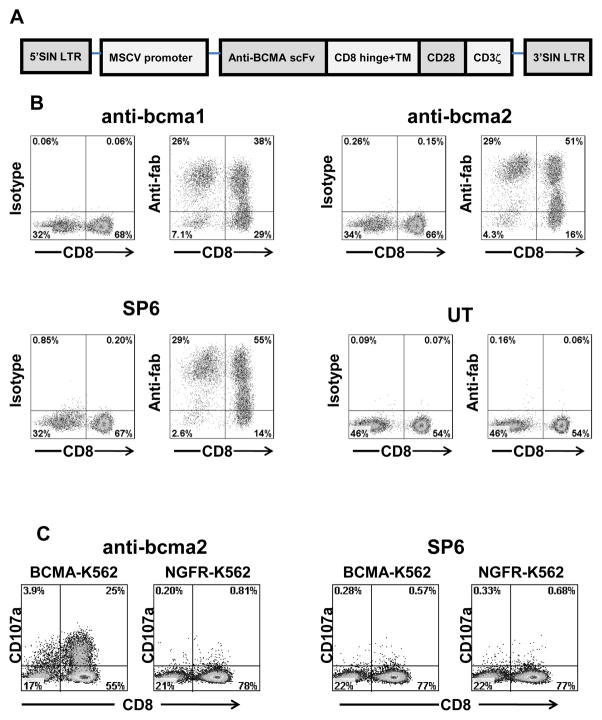
Figure 3.
Anti-BCMA CARs were expressed on the surface of T cells. A, A general diagram of anti-BCMA CAR fusion proteins is shown (LTR, long terminal repeat; MSCV, mouse stem cell virus; SIN, self-inactivating). From the N-terminus to the C-terminus, the anti-BCMA CARs all included an anti-BCMA scFv, the hinge and transmembrane (TM) regions of the CD8α molecule, the cytoplasmic portion of the CD28 molecule, and the cytoplasmic portion of the CD3ζ molecule. B, T cells from Donor B were transduced with lentiviral vectors encoding one of three CARs or left untransduced (UT). Expression of two anti-BCMA CARs, which were designated anti-bcma1 and anti-bcma2, was detected by flow cytometry 5 days after the transduction. Expression of the control CAR SP6 was also detected. As controls, isotype-matched antibody staining was included for each cell type. The plots are gated on CD3+ lymphocytes. The numbers on the plots are the percentages of cells in each quadrant. This is one of seven experiments with similar results. C, T cells were transduced with either the anti-BCMA CAR anti-bcma2 or the negative-control CAR SP6. The cells were cultured with either the BCMA-expressing cell line BCMA-K562 or the BCMA-negative cell line NGFR-K562 for 4 hours. After transduction with anti-bcma2, T cells degranulated in a BCMA-specific manner. SP6-transduced T cells from the same donors did not degranulate in a BCMA-specific manner. The plots are gated on live CD3+ lymphocytes. The numbers on the plots are the percentages of cells in each quadrant. This is one of three experiments with similar results.

