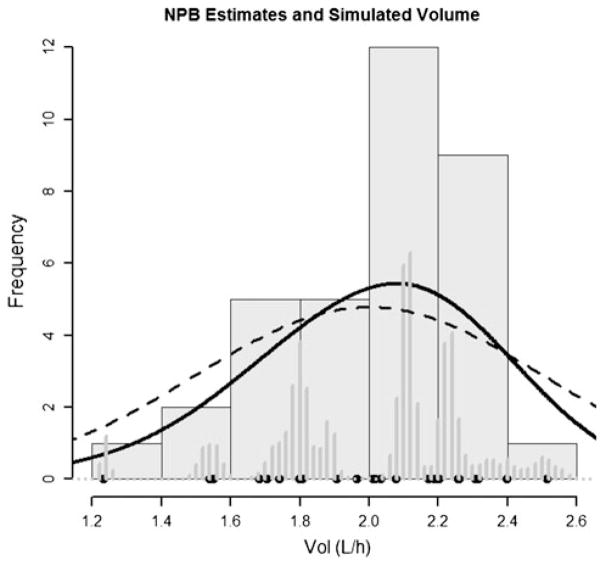
Fig. 2.
NPB distribution and simulated values for volume of distribution (VOL). Marginal distributions for simulated (true) parameter values are shown in black circles and seven filled histograms. The posterior distribution is represented in two ways (1) dark grey bars with binning (nbins = 50) and (2) a smoothed sum of normal distributions about the means of the distributions for each of the 17 support points (solid black line). True population distribution is shown as a dashed line

