
Table 2.
Comparison of strict morphology, abnormal chromatin structure, and abnormal chromatin condensation among (different) age groups
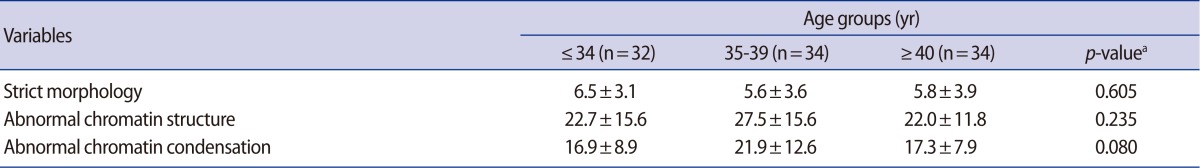
Values are presented as mean±SD.
aStatistical significances were tested by one-way analysis of variance among groups.