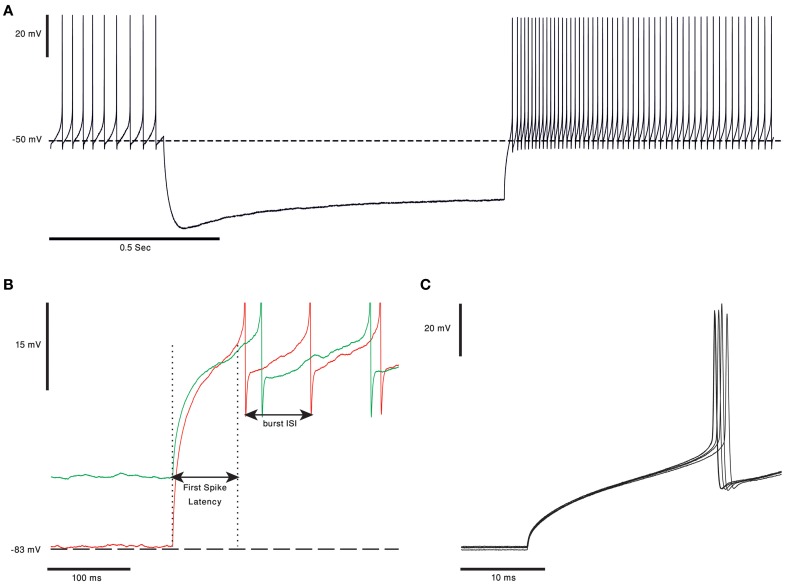
Figure 3.
Rebound burst in CN neurons. (A) Voltage trace from in vitro recording of a bPN. In response to 1 s of hyperpolarization the cell responds with a long rebound burst response, as evident in the increase in firing rate. Notice the voltage “sag” clearly visible during the hyperpolarization of the membrane voltage, probably due to activation of HCN channels (the voltage traces are courtesy of Dr. Uusisaari). (B) Rebound burst in response to different hyperpolarization levels. The first spike latency was shorter and burst frequency was higher when the membrane voltage was more hyperpolarized (red). Spikes were cut for better visualization. (C) The first spikes in the rebound burst from five repeats of the protocol, from panel (A), done on the same cell. The latency to the first spike has a clear and noticeable small jitter.

