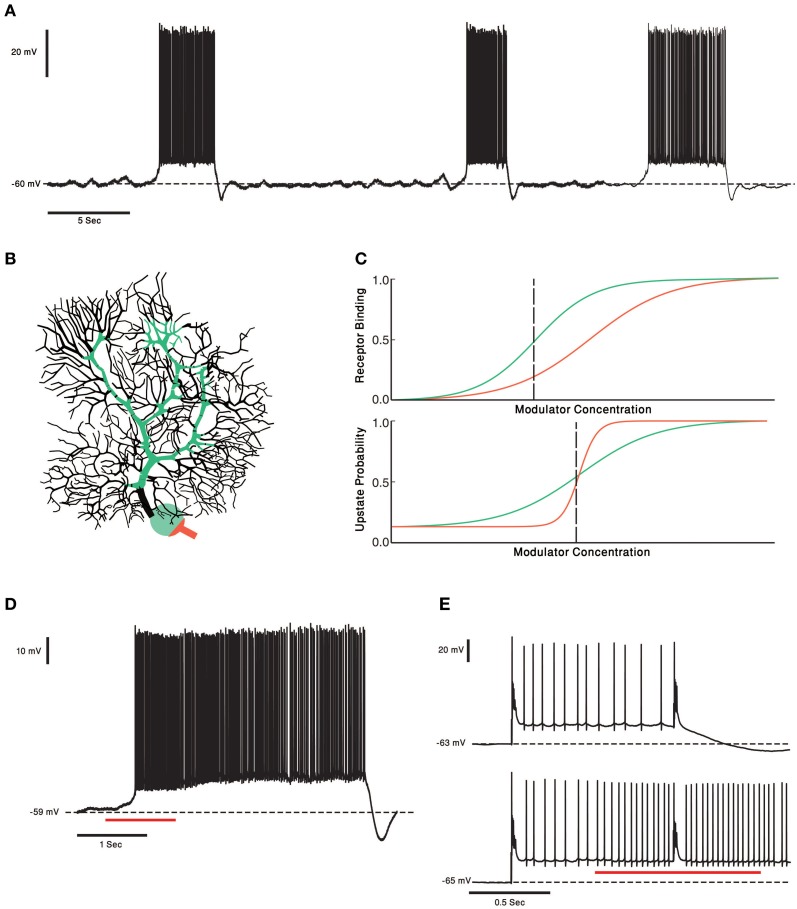
Figure 4.
PCs and two Receptors modulation. (A) Voltage trace from in vitro recording of a PC. The PC two states of membrane voltage, the “up” and “down” state are visible. (B) Schematic representation of the two receptor model. In this case the receptor with high affinity (green) is localized to soma and proximal dendrite and the Low affinity receptor (orange) is localized to the axon hillock and initial segment. This compart-mental distribution resembles the distribution of CRF receptors in PCs. (C) Schematic plot of the two receptor's affinities (upper panel). Activation of the receptors changes the PCs probability to be in an “up” state. The relationship between the neuromodulator concentration and the probability of the cell to be in an “up” state is depicted in the lower panel. Left of the black dashed line the PC has a probability to be in a “down” state. If the neuromodulators levels are to the right of the black dashed line the PC will be in an “up” state. (D) One second puff of 1 μM of CRF (red underline) shifts the Cell to an “up” state. In our toy model it means the concentration of CRF was to the right of the dashed black line. (E) Complex spike shifts the PC between the membrane voltage states (upper panel). In the presence of CRF (red underline) the complex spike was unable to shift the cell to a “down” state. The PC became less “sensitive” to input from the olivo- cerebellar loop, due to modulation by CRF.

