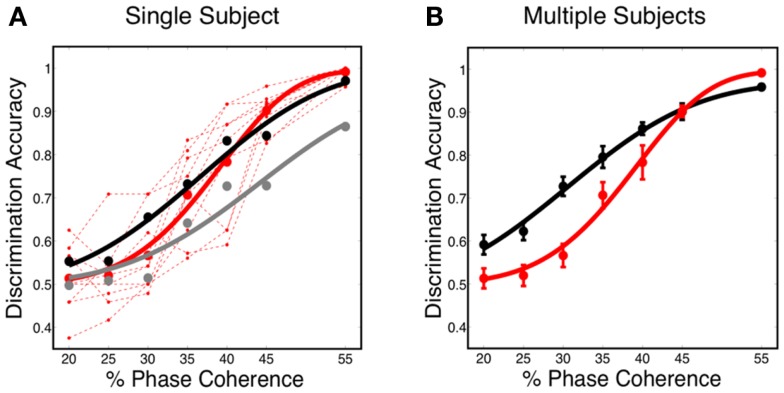
Figure 7.
(A) Simulated neurometric performance for one initialization of the V1 model. Shown are (black) neurometric curve constructed by decoding the full spatio-temporal word, D = 3.19, p = 0.53; (gray) neurometric curve constructed from a decoder that ignores dynamics, D = 52.26, p < 0.01. Also shown is (dashed red lines) the psychophysical performance of 10 human subjects, and (solid red curve) the group psychometric curve across 10 subjects. (B) Shown are (black) simulated neurometric performance averaged over five initializations of the model, together with (red) the average psychometric curve for the 10 human subjects. Error bars on both curves represent standard error. Likelihood ratio test yields D = 6.42, p = 0.17.

