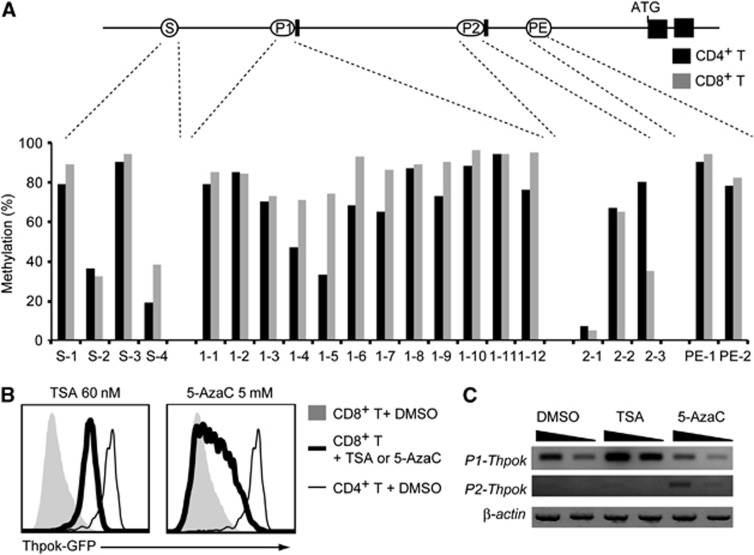
Figure 2.
Comparison of DNA methylation status of the Thpok locus in CD4+ and CD8+ T cells. (A) DNA methylation status in CD4+ and CD8+ T cells analysed by methylation-specific PCR at selected CpG islands located within the silencer (S), distal P1 promoter (P1), proximal P2 promoter (P2) and proximal enhancer (PE) are shown as percentages. (B) Effects of chemical inhibitors of histone deacetylases, Trichostatin A (TSA), and DNA methyltransferase, 5-aza-2′-cytidine (5-AzaC), on the Thpok repression. Histograms showing Thpok-GFP expression from the Thpokgfp allele in activated CD8+ T cells 3 days after treatment with either inhibitor in culture. Expression of GFP in control CD4+ T cells is shown as a thin line for reference. (C) Semi-quantitative RT–PCR for the P1 promoter- and the P2 promoter-derived Thpok mRNA after inhibitor treatment is shown with the β-actin mRNA as control. Wedges indicate 1:3 dilution of template. Data are from one of two independent experiments.
Source data for this figure is available on the online supplementary information page.

