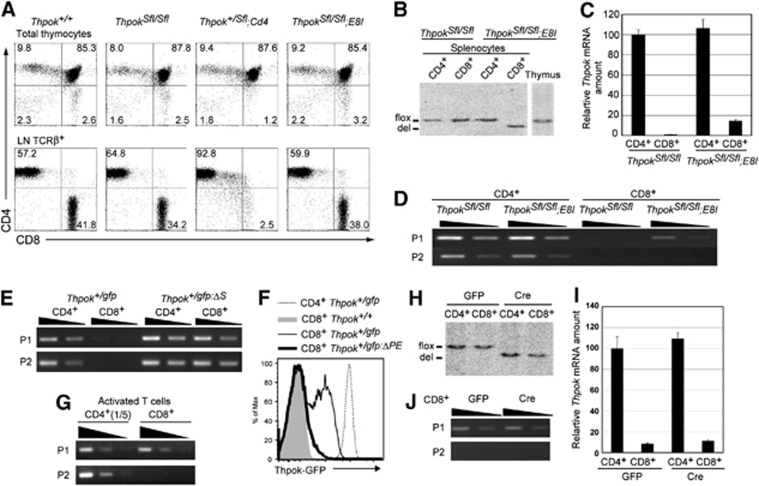
Figure 3.
Effects of conditional removal of the Thpok silencer in CD8-lineage cells on Thpok expression. (A) Dot plots showing CD4 and CD8 expression in total thymocytes and lymph node TCRβ+ T cells from mice of the indicated genotypes. Numbers in dot plots indicate the percentage of cells in each quadrant. (B–D) Genotype analyses by Southern blot (B), relative Thpok mRNA amounts (C) and semi-quantitative RT-PCR for the P1 promoter- and the P2 promoter-derived Thpok mRNA (D) in CD4+ and CD8+ T cells from the indicated mice. (E, G) Semi-quantitative RT–PCR for the P1 promoter- and the P2 promoter-derived gfp mRNA from the Thpokgfp and the silencer-deficient Thpokgfp:ΔS allele in CD4+ and CD8+ T cells (E), and for the P1- and P2-derived Thpok mRNA in activated CD4+ and CD8+ T cells (G). (F) Histogram showing Thpok-GFP expression in the indicated activated T cells of indicated genotypes. (H–J) Genotype analyses by Southern blot (H), relative Thpok mRNA amount (I) and semi-quantitative RT–PCR for the P1 promoter- and the P2 promoter-derived Thpok mRNA (J) in activated CD4+ and CD8+ T cells from ThpokSfl/Sfl mice transduced with control retroviral vector (GFP) or vector encoding Cre recombinase (Cre). Wedges in semi-quantitative RT–PCR assay indicate 1:3 dilution of template, except in (G) (1:5 dilutions). Data are from one of at least two independent experiments.
Source data for this figure is available on the online supplementary information page.

