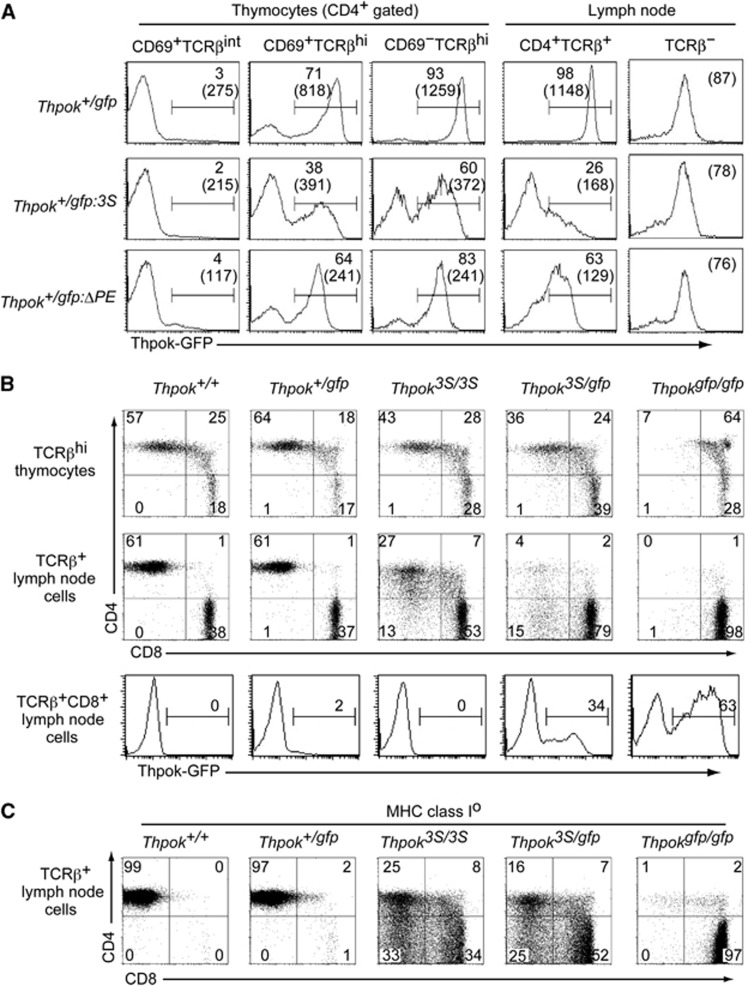
Figure 4.
Redirection of MHC class II-selected cells due to impaired Thpok expression by increase in the silencer copy number from one to three in the Thpok locus. (A) Histograms showing Thpok-GFP expression in the indicated T-cell subsets of Thpok+/gfp, Thpok+/gfp:3S and Thpok+/gfp:ΔPE mice. Numbers in the histogram indicate the percentage of GFP-positive cells, and numbers in parenthesis indicate the mean fluorescence intensity of GFP in GFP-positive cells. Notably, GFP expression in non-T cells of all three genotypes is same. (B) Dot plots showing CD4 and CD8 expression in mature (TCRβhi) thymocytes and lymph node (LN) TCRβ+ cells from mice of the indicated genotypes. Histograms show Thpok-GFP expression from the Thpokgfp allele in TCRβ+ CD8+ LN cells. Numbers in dot plots and histograms indicate the percentage of cells in each quadrant and the percentage of GFP-positive cells. (C) Dot plots showing CD4 and CD8 expression in lymph node TCRβ+ cells from mice of the indicated genotypes in the absence of cell surface expression of MHC class I molecules due to a genetic ablation of β2-microglobulin. Data are one representative of at least three independent experiments.

