Figure 1.

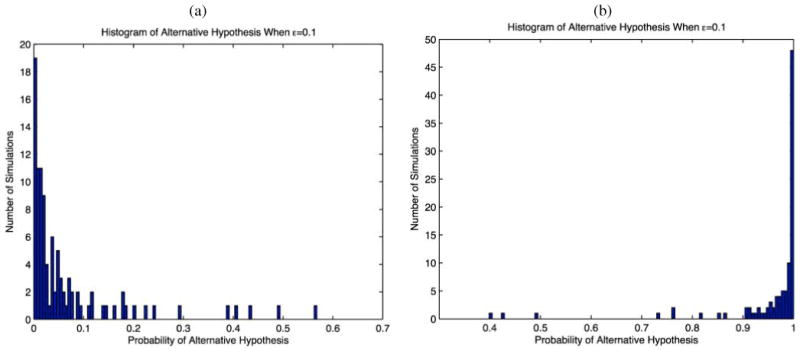
Histograms of estimated posterior probabilities of H1 in each of the 100 simulations under (a) case 1 (no positional dependence—H0 is true) and (b) case 2 (positional dependence—H1 is true).

Histograms of estimated posterior probabilities of H1 in each of the 100 simulations under (a) case 1 (no positional dependence—H0 is true) and (b) case 2 (positional dependence—H1 is true).