
Figure 6.
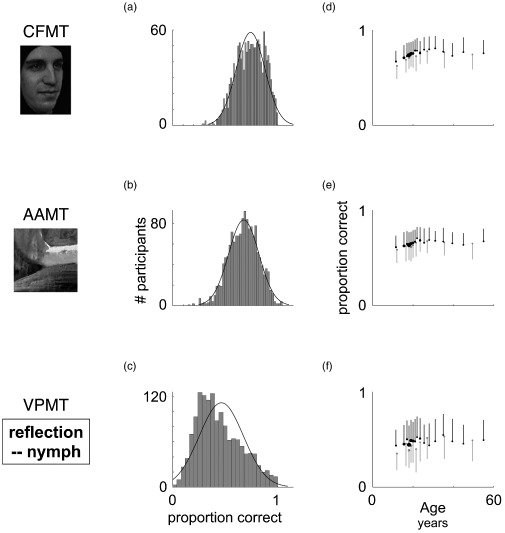
Norms. Data from our large normative data set (n = 1,471) are plotted. This data set is provided in its entirety, in item-by-item form, as supplementary information. X-axes for all graphs in each column are shown below C and F; Y-axes for all graphs in each column are shown beside B and E. (A–C) Overall distributions with best fitting normal curve. (D–F) Data plotted by age and sex, with females in black and males in grey. Vertical lines indicate standard deviation for each data point. For visibility, lines are plotted up for females and down for males. Each dot indicates mean peformance either at a single age or over several binned ages. Ages were binned when a single age had fewer than 35 participants, startingfrom the age of the youngest participant (9) and working upward. Horizontal position of dot indicates the mean age in that bin. Dots are drawn with areas proportional to the number of persons for that dot. CFMT = Cambridge Face Memory Test. AAMT = Abstract Art Memory Test. VPMT = Verbal Paired-Associates Memory Test.