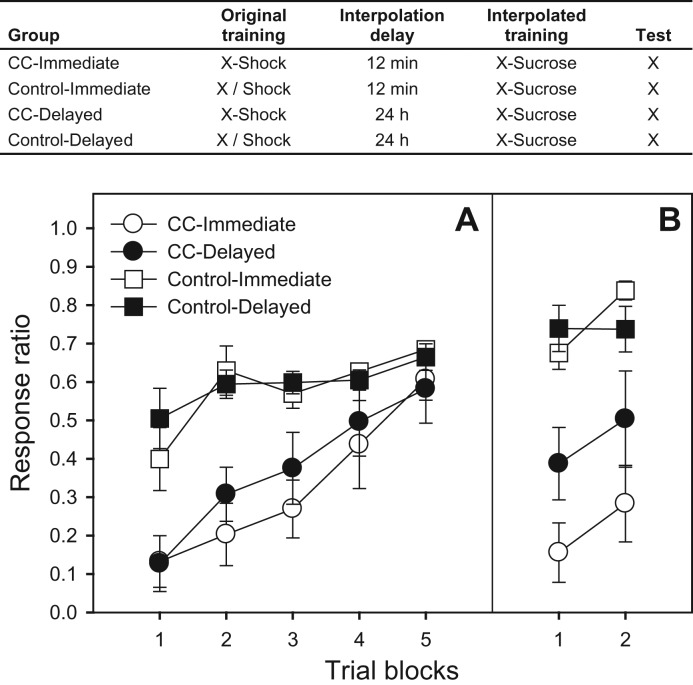
Figure 3.
The table presents a summary of the design of Experiment 3. Dashes (‘-’) represent paired presentations whereas slashes (‘/’) represent unpaired presentations. Panel A presents mean response ratios (±SEMs) over four-trial blocks for the interference (counterconditioning [CC]) phase of Experiment 3. Panel B presents mean response ratios (±SEMs) over two-trial blocks for the spontaneous recovery test, which occurred 48 h after CC treatment. Lower ratios reflect more response suppression (more fear), which is consistent with original (X-Shock) training, whereas higher ratios reflect less suppression (less fear), which is consistent with counterconditioning (X-Sucrose) training (i.e., retroactive interference).

