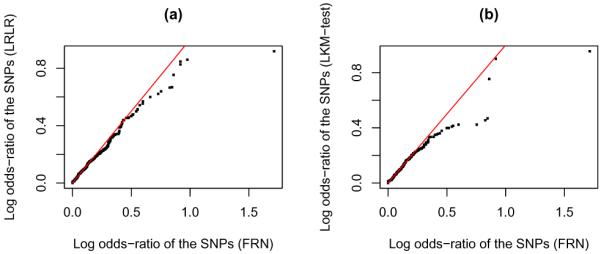
Figure 6.

Q-Q plots for (a) comparing log odds-ratio of the SNPs selected by FRN and the SNPs selected by LRLR and (b) comparing log odds-ratio of the SNPs selected by FRN and the SNPs selected by LKM-test. The selection of SNPs is done on CGEMS data. The log odds-ratio is calculated on Marshfield data.
