1. Introduction
Transient potassium currents (i.e., with activation and inactivation gating) have been implicated to underlie various neuronal firing properties: low frequency steady firing, long latencies before firing, bursting, etc (Connor and Stevens 1971; Connor et al 1977; Byrne 1980; Rush & Rinzel 1995; Golomb 2007; see also reviews: Rogawsky 1985; Rudy 1988; Yuan & Chen 2006). The possibilities for utilizing these currents to control latency with stimulus and intrinsic parameters have been explored in coding schemes for timing of excitatory and inhibitory inputs (Kanold & Manis 2005) and for temporal sequencing mechanism for pattern generation (Hooper 2002) and for regulating back-propagating action potentials in hippocampal neurons with implications for synaptic plasticity and learning (Adams et al 2000; Watanabe et al 2002).
This family of currents exhibits a broad range of voltage-gating properties; different exemplars activate over different voltage (V) ranges and likewise inactivation gating occurs in various V-ranges and gating evolves over wide time scales (Rudy 1988; Rudy et al 2010; Rush & Rinzel 1995). Traditionally, the family members carry names like: A-type, IK-A and D-type, ID. Nowadays, they are often described by their molecular structure (e.g., see Rudy et al 2010), e.g. Kv1.2, Kv4.3, etc, although we will not use this technical terminology here. Many of these currents activate fast (1-few ms) and, in some cases, steeply with V and in the subthreshold V-range (e.g., Rothman & Manis 2003). Inactivation gating can be very slow (100s to 1000s ms), e.g. ID, or moderately slow to fast (< 100 ms), e.g., many of the A-type currents. Slow inactivation underlies the long delays before repetitive firing in response to a step of depolarizing current or long-lasting barrage of synaptic excitation. A long latency may require priming by preceding hyperpolarization to reduce inactivation if the current is strongly inactivated at rest.
This delay property in models has been understood by using fast/slow analysis in which the inactivation variable (call it h) is treated as a parameter (Rush & Rinzel 1995; Golomb 2007). The delay before onset of firing corresponds to h starting from a moderate level so that IK-A is recruited when depolarizing input is delivered. Then V hovers at a sub-threshold level. While h slowly decreases, the current inactivates, V drifts modestly upward, and this pseudo steady state destabilizes – then firing begins (e.g., Connor and Stevens 1971; Storm 1988; Golomb 2007).
We consider here the dynamical properties of a neuron model that contains two transient potassium currents, IKif and IKis, that are fast and slowly inactivating, respectively. The model, a conductance-based single-compartment model of an auditory brain stem (dorsal cochlear nucleus, DCN) neuron, was developed by Kanold and Manis (Kanold & Manis, 2001) based on their voltage clamp recordings. We use the abbreviation KM model, later, in this paper. These DCN neurons receive both excitatory and inhibitory inputs, and they are involved in multi-modal sensory integration (Oertel & Young 2004). The simulated firing properties compare favorably to in vitro responses to current injection (Kanold & Manis 2001) and to synaptic inputs (Kanold & Manis 2005) and to in vivo recordings (Rhode et al 1983). Three firing patterns as responses to a depolarizing current step I0 were prominently featured: repetitive firing with no delay, repetitive firing after a delay (10s ms when IKif is dominant), with or without a leading spike (pauser or buildup, respectively). The different patterns are not cell/model specific. Each can be realized for a range of model parameters depending on I0 and on the holding state of hyperpolarization, Vhold. In addition, for both the neurons and the models, first spike latency FSL and first interspike interval FISI as functions of I0 and Vhold showed discontinuities corresponding to transitions between patterns.
We apply dynamical systems concepts (fast/slow analysis and phase plane treatments) to explain these firing properties, the patterns and the FSL/FISI dependencies, and to develop new insights into the dynamical mechanisms associated with the leading spike. In contrast to some previous modeling studies (Rush & Rinzel 1995; Wang 1993) we do not assume that the currents activate instantaneously. The finite (non-zero) time scale for activation gating (variables, mf and ms) is crucial for the generation of a leading spike. Moreover, we find, surprisingly, that these subthreshold activation dynamics underlie bistability in the spike-generating dynamics (the fast subsystem). In contrast, the bistability in other models (Rush & Rinzel 1995; Wang 1993) and that was exploited for burst generation, depended on mechanisms other than delayed but fast activation of the transient potassium current. Our insights are derived from our development of a reduced, three-variable, model (V, mf, hf). The reduced model (abbreviated as KM-LIF model later) based on an integrate-and-fire-like mechanism that incorporates the subthreshold activating IKif mimics the firing properties and bistability of the full model, and we analyze it in the phase-plane.
Finally, we demonstrate how the latency before repetitive firing can be controlled to cover a large range of values, 10s to 100s of milliseconds, by tuning of the relative amounts of IKif and IKis. The effects of mixture are clearly understood in terms of a combined inactivation, an effective inactivation variable heff. The fast/slow treatment considers both the fast and slow rates of heff.
2. Methods
2.1 Kanold and Manis model (KM model)
We consider the ten-variable HH-like model that was developed by Kanold and Manis to describe the firing properties of DCN pyramidal neurons (Kanold and Manis 2001). It incorporates HH-like sodium current INa, h-current Ih, and leak current Ileak as well as three different types of potassium currents: fast potassium A-current IKif, slow potassium A-current IKis and non-inactivating potassium current IKni. The current balance equation is:
where the gating variables satisfy equations of the form
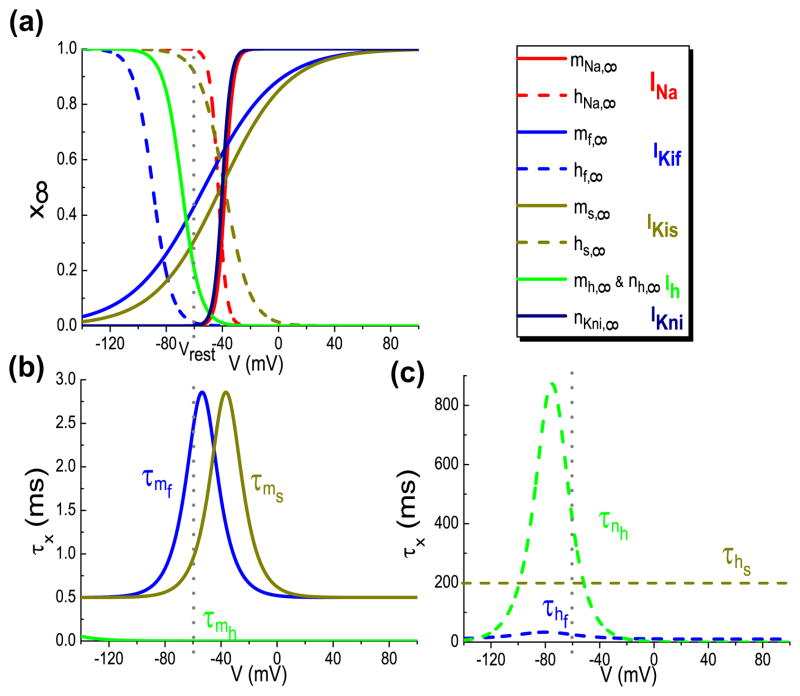
The voltage-dependent steady state function of the gating variable x is x∞(V) = 1/[1+exp((V − θx)/kx)] with the voltage-dependent time constant τx(V). The parameter values for gating dynamics (all in mV) are the same as those used by Kanold and Manis (2001): θmNa=−38, θhNa = −43, θnKni=−40, θmh =θnh= −68.9, θmf =−53, θhf = −89.6, θms=−40.9, θhs = −38.4; kmNa= khNa= knKni=3, kmh= knh= 6.5, kmf=25.8, khf=6.5, kms=23.7, khs=9. The membrane capacitance is, Cm=12.5 pF; the maximal channel conductances are (nS): ḡNa = 350, ḡKni = 80, ḡh = 3, ḡKif = 150, ḡKis = 40, gleak=2.8; The reversal potentials are (mV): VK= −81.5, VNa = 50, Vleak= −57.7, Vh= −43. The equations and expressions for all the activation/inactivation gating variables are identical to those given by Kanold and Manis (Kanold and Manis 2001). Figure 1 shows the steady-state and time constant functions of all the gating variables.
Fig. 1.
The voltage-dependent steady-state functions (a) and time constant functions (b, c) versus V for the gating variables of the ionic currents in the Kanold and Manis model (Kanold and Manis, 2001). The solid lines are for activation gating variables and dashed for inactivation gating variables
2.2 Computation
Most of the simulations for the KM model and phase-plane analysis were performed with XPPAUT (Ermentrout 2002); the bifurcation diagrams were obtained using the AUTO feature in XPPAUT. Differential equations were integrated with Gear’s method with tolerance parameter: 0.001 or smaller. The data for FSL (first spike latency) and FISI (first interspike interval) were calculated with C++ or with Matlab; the differential equations for the KM-LIF model were integrated with Euler’s method with stepsize =0.001ms and for the KM model with ode15s (in Matlab).
3. Results
Based on in vitro current and voltage clamp analysis Kanold and Manis developed a conductance-based model for DCN pyramidal cells (Kanold and Manis 2001), see Methods. They focused particularly on the latencies before repetitive firing and leading spikes for hyperpolarizing-then-depolarizing step current inputs. We elaborate on their treatment by isolating the primary biophysical mechanism (a subthreshold-activating transient potassium current) in our three-variable integrate-and-fire-based model. By way of dynamical systems analysis, we reveal the underlying dynamical mechanisms for the response properties that are shared by the full and reduced models. Moreover, two types of A-currents are included in the KM model. The faster one, IKif decreases during the pause/latency phase and the slow one, IKis, increases early in the pause and then may decrease. We will consider the combined effects of these two potassium currents later, in subsection 3.4; for now, we will focus on IKif.
3.1 Firing properties and a reduced KM model
Firing patterns
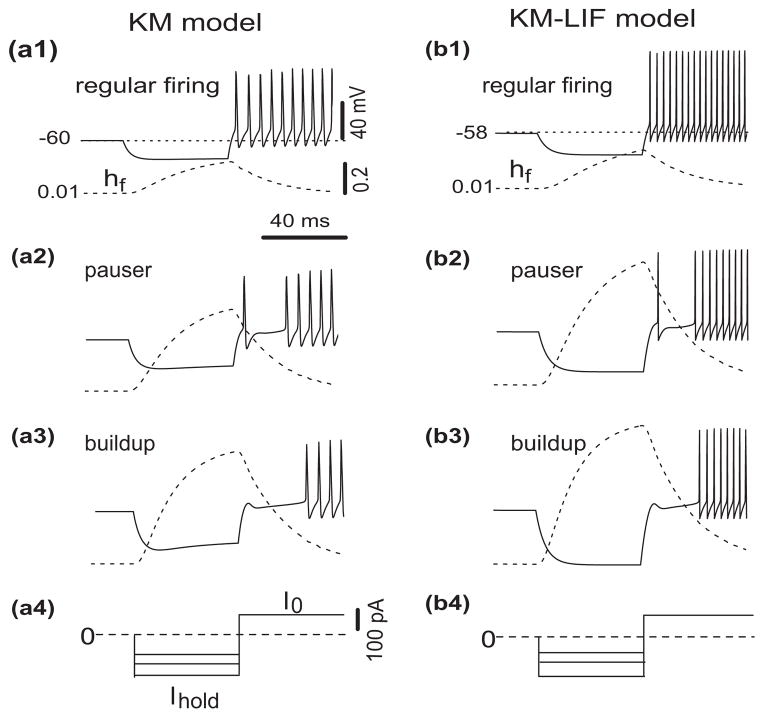
Three characteristic discharge patterns in DCN pyramidal cells have been observed both in vivo and in vitro: pauser, buildup and regular firing (Godfrey et al. 1975; Manis 1990). The KM model also exhibits these firing behaviors with hyperpolarization-then-depolarization stimuli (Fig. 2(a1–4)). The biophysical mechanism for the delay before repetitive firing during depolarization after hyperpolarization is due to a transient potassium current (IKif), that activates rapidly (time scale 1 ms) and inactivates more slowly (time scale 20 ms). The transient potassium current is nearly inactivated at the resting potential, Vrest= −60 mV. During hyperpolarization, inactivation is removed, i.e. hf of IKif increases. When the step current I0 is applied the neuron model depolarizes, IKif activates rapidly and slows the voltage increase. IKif then inactivates leading to the long pause before repetitive firing; see the time course of decreasing hf (dashed curve, Fig. 2(a2, a3)). The stronger and/or longer is the hyperpolarization, the more IKif is made available (by removal of inactivation) to increase the delay of the neuron firing after the onset of I0. The pause duration or latency has the time scale of hf. Although the KM model is consistent with the experimentally observed range of voltage dependence and channel kinetics and accounts for the various firing patterns, the ten-equation model poses a challenge for us to understand some of its underlying mathematical structure, and properties of DCN pyramidal cells, by way of dynamical analysis.
Fig. 2.
Responses of the KM model (left column) and the reduced model (right column) to different levels of prepulse hyperpolarization with a depolarizing current, I0, of 130 pA at t = 70 ms. For the KM model the amplitudes of the 50 ms hyperpolarizing currents are −100, −150 and −200 pA (a, 1–3), respectively. With increasingly stronger hyperpolarization the firing behavior switches from regular firing to pauser and from pauser to buildup. We apply similar 50ms-hyperpolarization-then-depolarization stimuli to our reduced KM-LIF model and confirm that KM-LIF behaves similarly. The amplitudes of hyperpolarizing current for the reduced model are −80, −147, −200 pA (b, 1–3). Because KM-LIF has no Ih-current less hyperpolarizing current is required to attain similar hyperpolarized V– values as in full model. The time courses (dashed) of the inactivation gating variable, hf, of the fast transient potassium current, IKif, show that hyperpolarization removes inactivation
Reduced model (KM-LIF)
To highlight the primary biophysical mechanisms for the firing patterns and to facilitate our dynamical analysis, we reduced the KM model by eliminating some nonessential features. We are interested in first spike and delayed onset of repetitive firing. We focus on the timing of these events rather than the timing of spikes within a sustained train. As a first approximation we neglect the slowly inactivating potassium current IKis, and the “sag” current Ih which is small during the pause. The spike recovery processes, IKni and inactivation of INa are unimportant for generating spike upstrokes. These simplifications lead to an integrate-and-fire model with sub-threshold nonlinearities and three variables: V, mf and hf. We noticed that post-spike V-minima were similar for all spikes, around −70 mV (e.g. Fig. 2(a, 1–3). Moreover, at these times the gating variable mf was around 0.6, nKni ≈ 0, and by the time that V returned to near Vrest, hNa was nearly recovered to 1. Thus, Na-inactivation and activation of IKni do not contribute to the next spike. For our integrate-and-fire model we reset V and mf accordingly which work well for a range of depolarizing inputs (Fig. 2(b, 1–3)). Our reduced model (KM-LIF) is given by
Notice that we do not treat the activation mf of IKif as infinitely fast, i.e., we do not set mf = mf,∞. The time scale and dynamics of mf are very important in accounting for the leading spike. If mf activated instantaneously as in some other models (e.g., Rush and Rinzel 1995; Wang 1993), we would capture latency properties, but we would preclude a leading spike. The firing patterns of the KM-LIF model (Fig. 2(b)) compare well with those of the KM model for similar hyperpolarization-then-depolarization stimuli. This agreement supports the hypothesis that the transient potassium current accounts for the different discharge patterns of DCN pyramidal cells as well as the sharp stimulus, dependent transitions between patterns. During hyperpolarization, hf of IKif in the KM-LIF model increases so that IKif can activate immediately at the beginning of depolarization and slow the membrane potential rise. As in the full KM model, the more hyperpolarized is the KM-LIF model, the more IKif deinacitivates. The reduced model has a similar plateau level during the pause, revealing that the plateau is essentially due to a balance among INa, Ileak and IKif.
Latency property
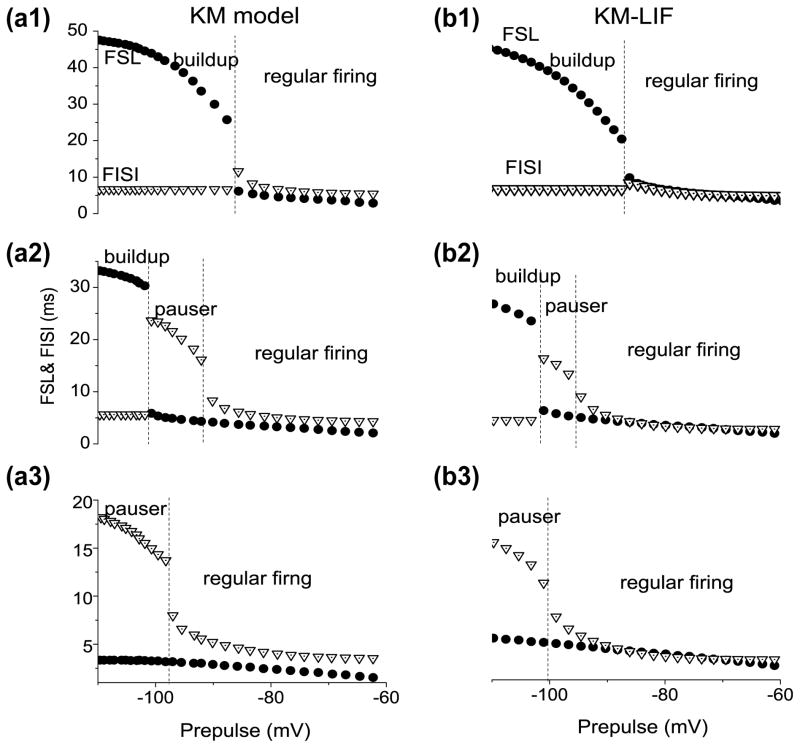
Both the first spike latency (FSL) and the first interspike interval (FISI) exhibit dependence on the depth and duration of hyperpolarization, that precedes the test depolarization in the KM and KM-LIF models (Fig. 3). For weak hyperpolarization, we have regular firing with little dependence of FSL and FISI on Vhold. However for stronger hyperpolarization, either FSL or FISI will change suddenly (e.g., Fig. 3(a2)). When the hyperpolarization is weak, both the FSL and FISI are nearly constant corresponding to the regular firing pattern. FISI increases dramatically for Vhold between −92 and −102 where the transition from regular firing to pauser occurs. As Vhold decreases further, FISI suddenly decreases to about 5 ms, while simultaneously FSL increases dramatically. This corresponds to the disappearance of the onset spike as the firing pattern transitions to buildup. The KM-LIF model captures these features including the discontinuity in FSL and FISI (Fig. 3(b, 1–3)). This sudden break between pauser and buildup, due to loss of the leading spike, will be explained with phase plane analysis in subsection 3.3. The break between buildup and regular firing or pauser and regular firing is due to the bistability which we analyze in subsection 3.2.
Fig. 3.
Voltage dependence of the first spike latency (FSL) and first interspike interval (FISI) in both the KM model and KM-LIF model. The depolarization currents in (a, 1–3) are 100, 150, 200 pA, while those in (b, 1–3) are 70, 120 and 160 pA. For the reduced model smaller current I0 yields similar behavior as the full model because KM-LIF lacks some recovery processes (IKni and inactivation of INa) but the maximal conductance of INa has not been reduced
3.2 Fast-slow analysis, hf as a slow variable
KM model
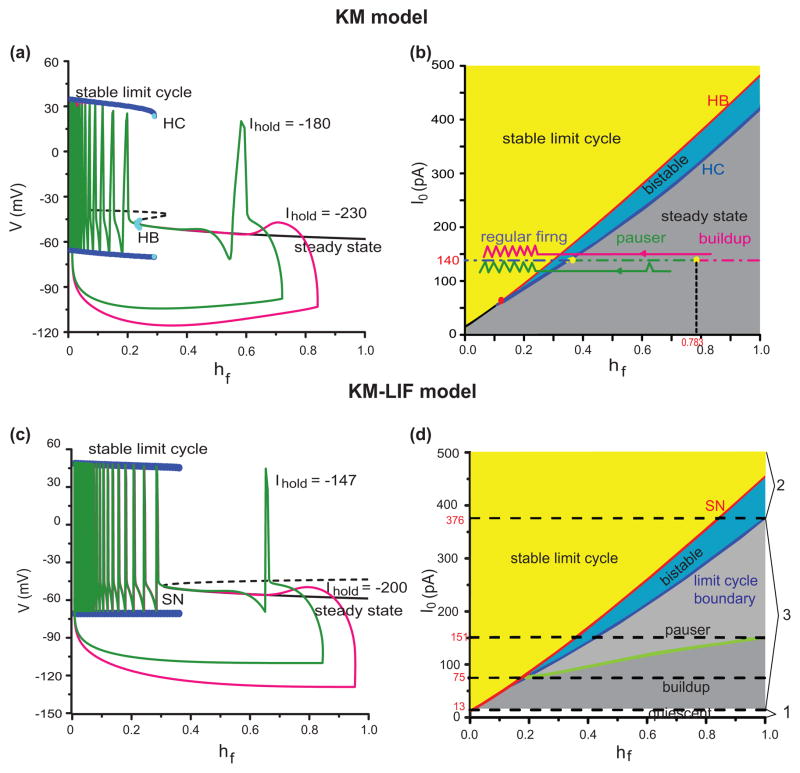
Due to the strong separation of time scales, we can apply fast-slow analysis to illustrate how the slow variable hf controls the firing patterns in the KM model (Fig. 4(a, b)). With hf treated as a parameter the fast subsystem has a steady state that corresponds to the latency/pause in the buildup and pauser patterns while the limit-cycle branch corresponds to repetitive spiking during depolarization (Fig. 4(a)). Here (Fig. 4(a)), we show two responses with the same depolarizing current I0 (I0=140 pA) but different hyperpolarization currents Ihold. With deeper hyperpolarization the leading spike is precluded because too much IKif activates at the beginning of depolarization. The levels of I0 and Ihold determine which pattern is elicited. We explore these dependencies by way of a 2-parameter bifurcation diagram (Fig. 4(b)). The parameter hf is a proxy for Ihold. The x-axis of panel (b) is the slow variable hf and the y-axis is depolarizing current, I0. The two responses from panel (a) are represented schematically in panel (b) where the flow is a leftward drift, corresponding to the slowly decreasing hf after the stimulus level switches from Ihold to I0. The starting point of a trajectory depends on Vhold. More negative Vhold means larger hf, saturating at 1. During the early portion of the response, the trajectory tracks the steady state, corresponding to the long pause. Then, after the stable steady state disappears repetitive firing begins. For I0 between 15 pA and 410 pA we find pauser or buildup patterns. For I0 < 15 pA there is no stable limit cycle (repetitive firing) regime; the membrane potential merely rises to a slightly higher level. If I0 exceeds 410 pA, the neuron will fire repetitively independent of Vhold. Whether a leading spike exists or not depends on Vhold, i.e. on hf when adequate I0 is evoked. If Vhold is too hyperpolarized, no leading spike occurs (Fig. 4(a), pink) but with less hyperpolarization it does (Fig. 4(a), green). There are three ranges for Vhold corresponding to immediate onset of regular firing, a leading spike and no leading spike (Fig. 4(b), blue, green, pink horizontal line segments, for I0 = 140 pA).
Fig. 4.
The underlying dynamical firing mechanisms in the KM model and the KM-LIF model. (a) Fast-slow analysis of the KM model with the slow inactivation variable hf of IKif treated as a parameter. Here, the value of hf is associated to the initial holding state. The blue lines (stable limit cycle) corresponds to the maximum and minimum V during repetitive firing (periodic) behavior and the black solid line (steady state) corresponds to the long pause. The steady state destabilizes through a subcritical Hopf bifurcation (HB, blue circle). The green line and the pink line are two trajectories of (hf, V) for different levels of hyperpolarizing holding current (green, −180 pA; pink, −230 pA) and for the same I0 = 140 pA. (b) Dependence of the dynamical properties of the KM model on the depolarizing current, I0. The gray regime corresponds to a stable steady state and the yellow regime corresponds to periodic behavior (stable limit cycle). There is a region for bistability (blue regime) where the stable steady state and periodic behavior coexistent. It lies (for a range of I0) between a subcritical Hopf bifurcation (HB) and a homoclinic bifurcation (HC). The horizontal green and pink lines that start from the holding states correspond to the two trajectories in (a). The blue, green and pink dot-dashed lines are the regimes of regular firing, pauser and buildup for a fixed I0 = 140 pA, respectively. (c) and (d) illustrate analogous features for the KM-LIF model. The curves in (c) have the same definitions and correspond to those in (a) with the same colors. The dashed black line corresponds to an unstable steady state which coalesces with the stable steady state at the SN point (saddle-node bifurcation) and both disappear. (d) Response regimes (assuming that hf is very slow) in which the three characteristic firing patterns (pauser, buildup, regular firing) and transitions between them can be realized in the two-parameter plane of (hf, I0) of the reduced model. Similar to the full KM model, KM-LIF also has three regimes: steady state regime (gray, light gray and the white areas), regime of periodic behavior (yellow) and the bistable regime (blue). Different color regions correspond to different firing behaviors: if hf lies inside the yellow or blue region, after hyperpolarization, regular firng will occur during depolarization (I0 > 13 pA); if hf lies in the light gray region, pauser will occur (75 < I0 < 376 pA); If hf lies inside the gray region (13<I0<151 pA), buildup will occur. Therefore, the types of transition for I0 should be: only regular firing to pauser (151–376 pA), both regular firing to pauser and pauser to buildup (75–151 pA) and only regular firing to buildup (13–75 pA)
There is a region of bistability (Fig. 4(b), blue region), where a stable steady state and a stable limit cycle coexist; it lies (for a range of I0) between a subcritical Hopf bifurcation (HB) and a homoclinic bifurcation (HC). We understand some discontinuities of FSL and FISI in Fig. 3 based on this bistable area. Consider the jump decrease in FISI for the transition between pauser and regular firing pattern (at the boundary between the green and blue segments of the dot-dash line in Fig. 4(b)). If hf begins in the gray area, V will track the stable point until it destabilizes (HB); FISI is large. If hf begins inside the bistable area, the response will be forced by the step current I0 to repetitive firing, i.e., to the attracting domain of the limit cycle; FISI is brief. Hence, the sharp break in FISI. Similar arguments account for the discontinuity in FSL between buildup and regular firing. The discontinuities in FISI and FSL between pauser and buildup are not due to this bistability, but to the presence or not of a leading spike.
KM-LIF model
Our reduced model exhibits dynamical states like those of the full KM model. When hf is treated as a parameter, the reduced model, KM-LIF, simplifies to just the V- mf subsystem. Both the fast-slow analysis and two-parameter bifurcation diagram of KM-LIF (Fig. 4(c, d)) share the qualitative features of the full model. As learned from our fast-slow analysis of the KM model, the existence of the steady state, limit cycle regimes and the bistability provide the dynamical bases for various features of the firing properties in the KM model, including the latency phase, the onset of repetitive firing, and some discontinuities in FISI and FSL.
Appearance of a leading spike – pauser or buildup?
The existence of the leading spike is not revealed by the fast-slow analysis in Fig. 4. It is a transient event, not a pseudo-steady-state property of the KM or KM-LIF systems with hf treated as a parameter. So, the boundary between pauser and buildup is not easy to analyze. However, because our reduced KM-LIF model has three variables, one of which changes slowly, we can describe the transition between pauser and buildup with phase plane analysis. Let’s suppose that: 1) the hyperpolarization is long-lasting (i.e., Ihold is applied so long that V reached a near steady value), and 2) that inactivation of IKif is very, very slow (i.e., τhf very large). Under these assumptions we can define all of the boundaries for the firing patterns (Fig. 4(d)).
In Fig. 4(d) we can easily identify three regimes of response. Regime 1: the depolarization current I0 is too weak to stimulate action potential (quiescent, 0 < I0 < 13 pA); Regime 2: the depolarization current is very strong (I0 > 375 pA) so that only regular firing occurs; Regime 3: if the depolarization is between the above two cases (13 < I0 < 375 pA), then regular firing (yellow and blue regions), pauser (light gray region) or buildup (gray region) may occur depending on the value of hf after hyperpolarization. Here we just present Fig. 4(d) as a “preview” which will be explained by way of phase plane analysis in the next section.
3.3 Phase-plane analysis for firing behaviors in the KM-LIF model
In order to understand the regions and the region boundaries in Fig. 4(d) we carry out phase plane analysis on the reduced model, treating the slow variable hf first as a parameter and examining the V-mf phase plane. We will warm up first by considering the buildup pattern. Then we will provide the phase plane characterization for the three regimes in Fig. 4(d): quiescence (small I0), regular firing at depolarization onset (large I0), and patterns that could involve latency with or without a leading spike (intermediate I0).
Buildup pattern in the phase plane
Let’s start by considering the simple case of release from hyper-polarization. We try to explain the onset mechanism of spiking by way of geometric analysis (phase plane portrait) (Fig. 5(a1, a2)). The V-nullcline and mf - nullclines are the curves along which dV/dt = 0 and dmf/dt = 0, respectively. We choose for geometric analysis the moment just after release from hyperpolarization. Because hf changes slowly, we suppose hf is constant during a spike. Figure 5(a1) shows the time courses of the KM-LIF model with different brief pulse stimuli at the beginning of depolarization. The green (black) curve corresponds to a strong (weak) pulse stimulus. In the V- mf phase plane, the cubic-shaped V-nullcline intersects the mf -nullcline at three points. The one on the left branch is stable; it corresponds to the membrane potential of latency (latency potential) during depolarization induced by I0 (I0=100 pA). The intersection in the middle branch is a saddle point. Its stable manifold corresponds to the threshold separatrix for action potential generation (orange, Fig. 5(a2)). If the brief pulse stimulus following the release from hyperpolarization is large enough, it will force the trajectory to cross the threshold separatrix and lead to a spike (green, (a2)). Otherwise, although the membrane potential increases transiently due to the pulse, the trajectory cannot escape from the attracting domain of the steady state and it will converge to the rest state (black, (a2)).
Fig. 5.
Dynamical analysis of the first spike threshold and latency. (a1) Time courses of the KM-LIF model with different brief (1ms) pulse stimuli at the onset of depolarization (I0=100 pA). Becaue hf changes slowly, we suppose that hf is constant during a spike. The green curve corresponds to a strong pulse stimulus, while the black curve corresponds to a weak pulse stimulus. (a2) Phase plane portraits for V and mf in the KM-LIF model with hf fixed to its value at the end of a 50 ms hyperpolarization (hf =0.86): V-nullcline (blue), mf-nullcline (red) and the threshold separatrix (orange, unique trajectories that enter the saddle point). The black and green curves are the trajectories corresponding to the time course of (a1). (b1) An example of buildup. The time courses of V (green) and hf (black) corresponding to a 50 ms hyperpolarization (Ihold=−150pA)-and-then-depolarization (I0=100pA) stimulus. (b2) Phase plane diagram of V vs. mf during the process of depolarization in (b1). The blue curves are the V-nullclines with different hf. During depolarization the V-nullcline drifts upward with hf decreasing. The green curve is the trajectory of V and mf under the same stimulus as in (b1). The solid circles of different colors (red, pink, yellow) in (b1) denote the same system states as those in (b2), respectively
Now we will take the dynamics of the slow variable hf into account (Fig. 5(b1, b2)). During hyperpolarization hf increases. The dashed blue curve in Fig. 5(b2) is the V-nullcline just before I0 is applied. The red point is the holding state at that time. During depolarization, hf slowly decreases and the cubic-shaped V-nullcline drifts upward. The mf -nullcline (red) is just mf,∞ vs V: it does not change with I0 or hf. Several V-nullclines are shown for values of hf: 0.86, 0.5, 0.23, and 0.01. At the beginning of depolarization (I0=100 pA), hf equals to 0.86. The V-nullcline intersects the mf-nullcline at three points (as in (a2)). Here, the holding state is in the attracting domain of the rest state, so that the trajectory will converge directly to the rest state (no leading spike). The V-nullcline continues moving upward as hf decreases. When hf decreases to 0.23, the V-nullcline becomes tangent with the mf -nullcine. The stable steady state on the left branch disappears (saddle-node bifurcation) and so does the attraction for this region. Therefore, V (under the V-nullcline) begins to rise (purple open circle, (b2)); an upstroke ensues and repetitive spiking occurs (Fig. 5(b1, b2)).
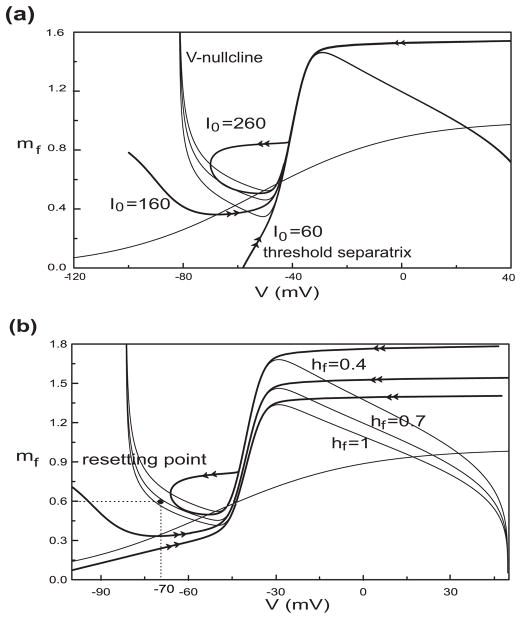
The threshold separatrix combined with the state of membrane potential determines the possibility of a leading spike. Only when the state (V, mf) is outside of the attracting domain of rest state, will there be a leading spike. Therefore, in order to understand the mechanism for the firing pattern, we consider the factors that influence the separatrix. From Fig. 5(b2) and Fig. 6, we can see that not only decreasing hf but also increasing I0 lifts the V-nullcline. Simultaneously, the threshold separatrix becomes more U-shaped then loop-like before it disappears when the rest state and saddle point merge and likewise disappear.
Fig. 6.
Dependence of the threshold separatrix (double arrow) on I0 and hf. (a) shows the separatrix for I0 = 60, 160, 260 pA with hf fixed at 0.7; (b) shows the separatrix for hf=1, 0.7, 0.4 with I0 fixed at 150 pA. The V-nullcline rises with I0 increasing or hf decreasing. The threshold separatrix becomes moren “U”-shaped and then loop-like when the V-nullcline moves up enough. In these cases, the resetting point (black solid circle in panel (b), V = −70 mV, mf = 0.6) maybe be outside of the attracting domain of the depolarization steady state
In Fig. 6(b), we can understand why there is a bistable area in Fig. 4(d). For hf equal to 0.4 the V-nullcline intersects the mf-nullcline at three points. The one on the left branch is a stable steady state. The threshold separatrix corresponding to this case is loop-like with the resetting point (black solid circle) outside the attracting domain of the depolarized rest state, which means that the repetitive firing behavior (stable limit cycle) exists according to our resetting condition.
Phase-plane explanation for three characteristic firing patterns
Here, we carry out phase plane analysis to describe the three firing regimes as represented in Fig. 4(d), classifying them according to the strength of depolarization.
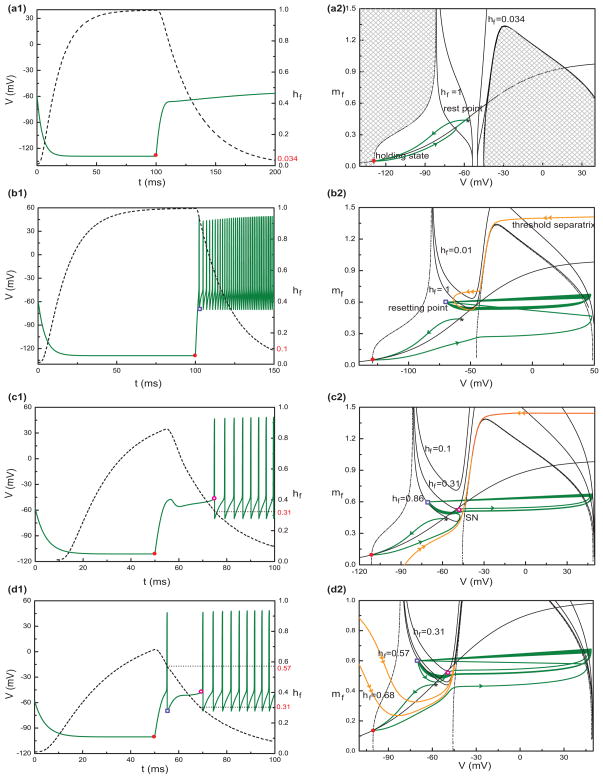
Case 1: weak depolarizing stimuli (0 ≤ I0 ≤ 13 pA); see Fig. 7(a1, a2). First, let’s consider the holding state. Here (as in Fig. 5(b2)), the V-nullcline is not necessarily cubic-shaped, but rather composed of two disconnected portions (dashed). The right portion has an inverted U-shape and the left portion is monotonic increasing with V, asymptoting vertically as V approaches VK from below. The shaded areas show where dV/dt > 0; crossing the V-nullcline from these areas, dV/dt becomes negative. The holding state (solid circle) corresponds to the intersection of the V-nullcline’s left portion and the mf-nullcline; it is stable. The threshold separatix (in this case) lies very close to the left leg of the inverted-U, indistinguishable here. Moreover, for small I0 the V-nullcline is still comprised of two portions. The inverted U-shaped curve persists but the left portion flips to become monotonic decreasing and the steady state for this intersection with the mf-nullcline is stable. The V-nullclines are shown in Fig. 7(a2) for I0=10 pA and several values of hf. The separatrix remains near-vertical over the range of hf. The trajectory from any point which is leftward of the inverted-U will converge to the stable point which will not disappear when the V-nullcline rises up as hf decreases during depolarization. Therefore, the holding state is in the attracting domain of the barely depolarized rest state no matter what is Vhold, that is, its trajectory has no chance to escape from this attracting steady state.
Fig. 7.
Phase-plane explanation for the response regimes in Fig. 4(d). Panels (a1) and (a2) are for the case of quiescence. (a1): Sample time courses of V (solid) and hf (dashed) with I0 = 10 pA and Ihold = −200pA. The filled circle denotes the holding state. (a2): Phase plane analysis for the case in (a1). The dashed line is the V-nullcline with hf =1 at the end of hyperpolarization (Ihold= −200 pA). The shaded areas show where dV/dt > 0 at that time; dV/dt becomes negative as soon as a trajectory crosses the V-nullcline from these areas. The solid lines are all for depolarization during which hf decreases. Similar to the hyperpolarization case, the areas leftward of the left portion of the V-nullcline or under the inverted U-shaped curve (not shown completely) show where dV/dt> 0 corresponding to hf=1 and 0.034, respectively, while dV/dt becomes negative outside these areas. The solid curve with two arrows is the trajectory corresponding to (a1); flow is down and left from the rest state to the holding state during the hyperpolarization and then up and right toward the stable state of depolarization. Similarly, panels (b1) and (b2) show, respectively, the sample time courses (Ihold = −200 pA, I0 = 400 pA) and the corresponding phase plane analysis for the case of regular firing. The curves in (b1, b2) are defined similar to those in (a1, a2). The open square is the resetting point (V= −70 mV, mf = 0.6) which is outside of the loop-like threshold separatrix (curve with double arrows). Panels (c1, c2) and (d1, d2) illustrate the transition mechanism from pauser to buildup with a fixed depolarizing current (I0=130pA) but different levels of pre-hyperpolarization. With strong enough hyperpolarization, Ihold = −150 pA (c1, c2), hf increases to 0.86. Both the holding state (black circle) and the resetting state (d2) are leftward of the threshold separatrix (double arrows), i.e., they are subthreshold, inside the steady state’s attracting domain. The trajectory (single arrow) will converge directly to the steady state upon depolarization. The periodic behavior occurs after the steady state disappears through a saddle-node bifurcation (open circle), i.e., the left and the middle branches of the V-nullcline become tangent with the mf-nullcline (hf=0.31). For (d1, d2), hf is 0.68 just after hyperpolarization (Ihold = −120 pA). The threshold separatrix is more U-shaped and the holding state is superthreshold. The trajectory immediately goes rightward and the system will be reset after an upstroke occurs (hf = 0.57). Because the resetting point (open square) is in the rest state’s attracting domain, the trajectory will converge to the rest state and wait for the resetting state to disappear after which repetitive firing ensues
Case 2: strong depolarizing stimuli (I0 ≥ 375 pA). The V-nullcline is lifted upward dramatically because of strong I0. It may not intersect the mf-nullcline in which case there is no subthreshold stable steady state. Hence, there will be regular firing at the onset of I0. Even if for some I0 and hf near to 1 the nullclines intersect, the stable point and the saddle are close together. Moreover, the threshold separatrix does not drop vertically to mf = 0; rather, the separatrix is typically loop-like (double arrows, Fig. 7(b2)). Both the holding point (solid circle, Fig. 7(b2)) and resetting point (open square, Fig. 7(b2)) will be outside the attracting domain of the depolarized rest state. Therefore, the trajectories that emanate from the holding point and the resetting point will proceed directly to an upstroke without being attracted by the lower stable point. Hence we have regular firing at the onset of I0 (Fig. 7(b2)).
Case 3: I0 is between the ranges for Cases 1 and 2. During depolarization the V-nullcline typically intersects the mf-nullcline and with significant separation between the lower stable point and the saddle. In this case, either the holding point or the resetting point may be within the attracting domain of the depolarized rest state. Hence, there are two sub-cases: 3A, both the holding point and resetting point is in the resting state’s attracting domain; 3B, the resetting point is in the attracting domain but the holding state is outside. For sub-case 3A, because the holding state is attracted by the rest state at the onset of I0, its trajectory will converge to the (slowly moving) rest state and firing occurs only after the rest state disappears. This corresponds to a buildup pattern (Fig. 7(c1, 2)). For sub-case 3B, because the holding state lies outside the attracting domain of the rest state, its trajectory immediately goes rightward; a spike upstroke occurs and the system will be reset. Because in this case the resetting point is in the rest state’s attracting domain, the trajectory will converge to the rest state and wait (for a time of order, τhf) for the resetting state to disappear (saddle-node bifurcation). Then repetitive firing ensues. This is the case of pauser (Fig. 7(d1, d2)).
3.4 A mixture of two transient potassium currents
In the preceding sections we focused on the dynamics of IKif, without consideration of the effects of IKis and, for simplicity, not including IKis in the reduced model. Here, we consider the dual contributions of these two currents in the full model, allowing for a mixture over a range of relative ḡ values. Compared to IKif, IKis has similar activation kinetics but its inactivation gating is much slower (200 ms vs 50 ms or less for hf) and shifted to higher voltages (θhs = −38.4 mV, θhf =−89.6 mV). In the original KM model ḡKis (40) is only about 20% of the total (190). It does however influence the latency, and in an interesting way. While gKif is inactivating, gKis although smaller is activating (Fig. 8(a, b)); the conductances become comparable later in the pause. Over this plateau’s voltage range gKis does not inactivate. The effect of this slow rise by gKis, in opposition to gKif, is to extend the latency. For comparison, notice the shorter latency and more rapid fall of gKif in case we freeze gKis in the model (Fig. 8(a), V(t), gray).
Fig. 8.
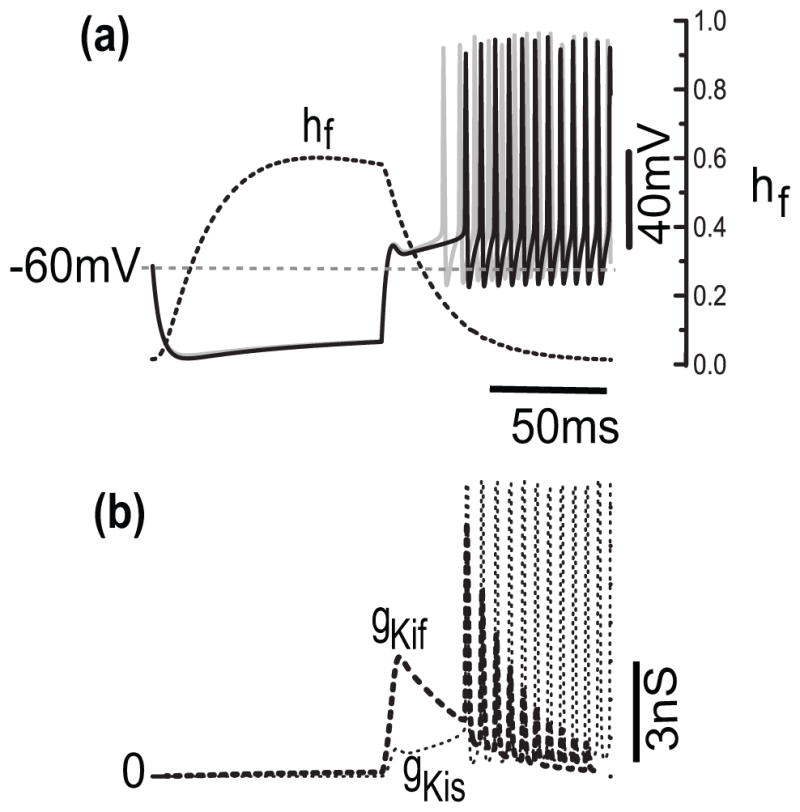
Opposing dynamics of conductances for IKif and IKis for short latencies. (a) Time courses of V (solid) and hf (dotted) corresponding to 100 ms hyperpolarization-and-then depolarization (Ihold = −150 pA, then I0=180 pA). Here, ḡKis is 21% of the maximal total conductance ḡKif + ḡKis. (b) Time courses of the conductance for fast and slow transient potassium currents, gKif and gKis, respectively, with the same stimulus as in a. In this example, gKif decreases while gKis increases. The slow rise of gKis prolongs the latency before regular firing. The latency becomes shorter in case we freeze gKis in the model ((a), gray curve) to its value at rest
There is considerable heterogeneity amongst DCN neurons in the V-gating properties of gKif (Kanold and Manis 2001); we expect the same for gKis as well as in the relative mixture of IKif and IKis. Mixing fast and slowly inactivating transient potassium currents opens possibilities for responses with a wide range of latencies and an enhanced role for IKis in creating long delays -- long enough for gKif to completely inactivate and gKis to control the latency plateau.
In order to address the effects of such mixing we introduce a simplification. Because mf and ms have similar gating dynamics (steady state and time constant functions), we will assume mf(t) = ms(t) and write the combined current as:
where GKi = ḡKif + ḡKis
Let ρ = ḡKis/GKi, then
Where heff is the combined slow variable: heff = (1−ρ)hf + ρ hs that embodies a fast and a slow component.
Here, ρ represents the proportion between IKis and IKif. If ρ is close to 1, it means gKis is plentiful. Conversely, if ρ is close to 0, gKif is plentiful. Which one dominates the latency and dynamics depends of course on ρ and where the operating voltage range lies with respect to θhf and θhs, i.e., which will determine the extent to which each inactivation process evolves.
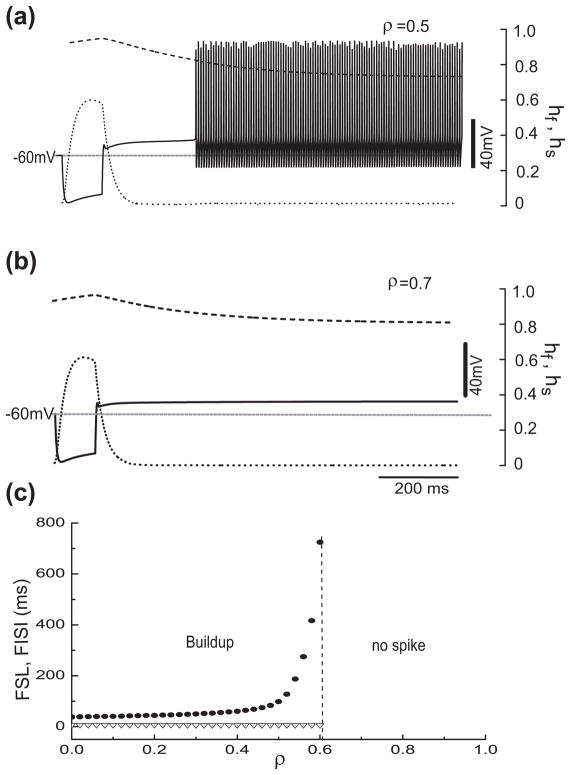
Figure 9 illustrates how the firing behavior changes with ρ for pauser-type responses; the case of buildup is similar, but without a leading spike (not shown). As ρ increases the pause duration grows (Fig. 9(a, b)) with FISI becoming infinite as ρ approaches a critical value. Beyond this limit the firing pattern changes; repetitive spiking disappears and only the leading spike remains. The neuron becomes phasic - firing just one spike at step current onset. Notice that the potential during the pause is around −50 mV. At this level, IKis can not inactivate completely; hs settles down to approximately 0.8. This demonstrates that IKis can control the membrane potential or even preclude repetitive firing if it is present in large enough proportion.
Fig. 9.
The fractional amount ρ of IKis in a mixture of the two transient potassium currents, IKif and IKis, significantly affects the latency. (a) and (b) The time courses corresponding to the same hyperpolarization (Ihold = −150 pA) and the same depolarization (I0 = 180 pA) but with different ρ ((a): ρ=0.35; (b): ρ=0.45). More IKis leads to longer latencies. (c) FSL (solid circle) and FISI (triangle) versus ρ for the same stimuli as in a and b
The dynamical possibilities can be well understood by a fast-slow analysis in which heff is treated as the slow variable. Analogous to Fig. 4(a) we see in Fig. 10(a) the (stable) pseudo steady state around −50 mV for heff large enough, corresponding to the plateau voltage during the delay. The pauser response (time course in inset (a1)) tracks this steady state as the mixture current inactivates. At this ρ value, IKis dominates and controls the very long latency; heff is still decreasing at 500 ms while the system is in repetitive firing mode, appearing to asymptote to a steady state level at about 0.45.
Fig. 10.
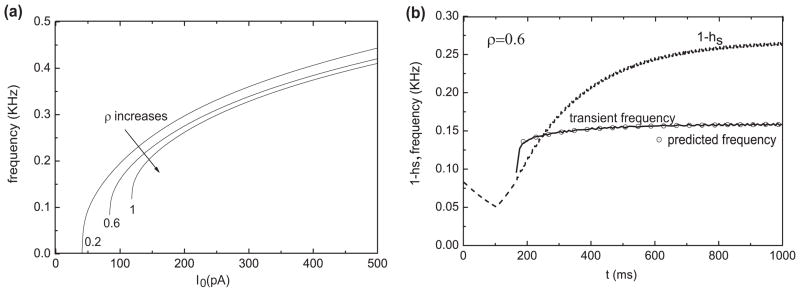
Fast/slow analysis of latency and firing patterns for a mixture of transient potassium currents. (a) Bifurcation diagram with heff treated as a parameter; I0= 300 pA applied at t=100ms (*) from a long-duration holding level Ihold = −150 pA. Inset (a1) shows the time courses of V and inactivation variables for the pauser response. The time course of heff decreases during the latency phase on two time scales, fast then slow. The trajectory of the response is projected onto the heff-V plane in (a). The transition to repetitive firing occurs after the trajectory drifts inside the Hopf bifurcation point, HB. At this I0 level bistability occurs for (approximately) 0.5 < heff < 0.6. (b) Illustration of a switch in control from hf to hs of the pause duration for I0 = 300 pA. The bifurcation diagram from (a) is redrawn here: the solid circles correspond to the temporal mean of V during periodic firing and the thick solid line to the stable steady state. The four thin solid lines are heff, ∞ vs. V (i.e., heff – nullclines) with ρ=0.2, 0.4, 0.6. 0.8, respectively. Their intersections (open squares) with the bifurcation diagram correspond to the steady behaviors for different ρ. In order to show the different time scale of heff, we take ρ=0.6 for example (the same as (a)) and superimpose the corresponding trajectory of (heff, V) into (b). It starts from the holding state (*). At depolarization onset the trajectory is nearly linear with slope of 1−ρ because of the much slower changing of hs (dotted line). After hf decreases close to 0, heff decreases slowly with the similar time scale of hs. The short vertical bars are for equally spaced time points (4 ms) chosen from the trajectory of (heff, V) corresponding to the trajectory in (a). The increasing density along the trajectory reflects the decreasing speed of heff
The steady state value for heff, call it h̄eff, can be predicted as follows. Since both hs and hf are slow they will each approach a steady value as the system converges to steady behavior, either a time-independent steady state (V̄ =Vss) or steady repetitive firing, a limit cycle on the fast time scale (take V̄ as the time average of VLC(t) ). The value of h̄eff will satisfy the steady state heff vs V̄ relationship:
The left-hand side of this equation represents the relationship between heff and the steady behavior quantified by V̄; that is, the relationship expressed in the bifurcation diagram with heff treated as a parameter. The right-hand side is just heff,∞ versus V. The solution is understood graphically by superimposing the plot heff,∞ versus V on the bifurcation diagram. In Fig. 10(b) we have superimposed the plots for 4 values of ρ. As ρ increases we see the dominance of hs,∞ emerge with its half-inactivation value at θhs = −38.4 mV. The intersection points (h̄eff, V̄) are indicated by the open squares for the respective ρ-values. For small ρ, the model’s steady behavior will be repetitive firing with h̄eff at a low value, corresponding to little IKis and IKif totally inactivated. For ρ closer to one this analysis predicts that the system will be stationary at constant V between −55 and −50 mV and h̄eff dominated by hs,∞ which equals 0.74 at V= −50 mV. This stationary behavior would be analogous to the plateau seen in Fig. 10(b), either with or without a leading spike, depending on I0 and the preceding holding state.
The pauser response for ρ = 0.6 from Fig. 10(a) is represented in Fig. 10(b) by discrete points from the time course (the short vertical lines at equally spaced time increments of 4 ms). The flow of this trajectory is from right to left, heff decreasing from the holding state (*). The response tracks the steady state (leading spike not shown) during the pause/latency phase before transitioning (at heff ≈ 0.5) into the repetitive firing state after the steady state destabilizes at the Hopf bifurcation, HB. Repetitive firing evolves slowly to a steady frequency as heff further decreases toward h̄eff (≈ 0.41).
During the latency period we see (Fig. 10(a1)) the multi-timescale behavior of heff(t): an early drop and then more gradual decay to h̄eff due to the relatively fast and complete inactivation of IKif and slower (partial) inactivation of IKis. These two time scales are reflected in the discrete time representation in Fig. 10(b); the data points are far apart in the early phase when heff decays to zero relatively fast and then the data points are closer together, piling up as heff, dominated by hs, slowly approaches h̄eff. The change in heff decay speed can also be understood from the superimposed curve of hf vs. heff (Fig. 10(b) dashed and solid portions, labeled ρ=0.6). The solid part of this curve (beginning at *) is from the pauser time course and shows hf decreasing to zero (less than our criterion level of 0.003, marked by open circles). From this point onward, along the trajectory, the latency is determined by hs. The dashed part of the curve is a straight line, an approximation to this trajectory if hs were very slow. That is, during the fast decay phase of hf, we assume that hs is constant equal to its value hs,hold (≈ 1) at the termination of the holding state so that heff = (1−ρ) hf + ρ hs,hold, giving a linear relationship between heff and hf. We have indicated for other ρ-values (open circles on the heff-axis) the heff values where hf is effectively zero after decaying from a holding state, at which the latency is controlled by hs.
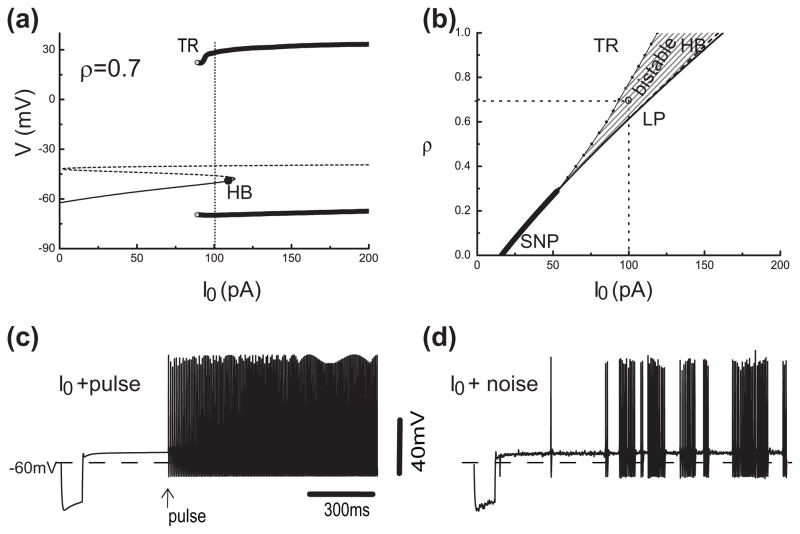
The diagrams in Fig. 10 lead to a prediction about bistability for the full KM model. Notice that for ρ = 0.8 that the heff,∞ vs V curve is close to intersecting with the bifurcation diagram at two points, on the Vss and VLC branches. Indeed, we find that for a slightly smaller ρ-value (say, 0.75) the KM model has both a stable repetitive firing state and a stable plateau state (V≈ −50 mV). Such bistability in the presence of noise would lead to irregular alternations between these two states (bursting).
Now, remember that the curves, except for the heff,∞ vs. V curves, depend on I0. We can expect that for larger I0 the bifurcation diagram will shift rightward thereby enlarging the ρ-range for steady firing and that relatively more IKis is needed to block repetitive firing.
Finally, we note that the analysis about mixtures that we presented for the full KM could be applied also the KM-LIF model.
4. Discussion
Our investigation has exposed the underlying dynamical mechanisms for the various discharge behaviors of the conductance-based “KM” model (Kanold and Manis 2001) for DCN pyramidal cells as well as for the sharp stimulus-dependent transitions between firing patterns by way of non-linear dynamical systems theory. The model features two transient potassium currents, IKif and IKis, with fast and slow inactivation, respectively. We developed, for the case when the faster inactivating IKif dominates, a reduced three-variable LIF-like model (KM-LIF) that accounts very well for the firing behaviors in the full KM model. This reduction enabled us to identify more explicitly how IKif influences dynamically the onset firing and latencies in the buildup, pauser and regular firing (i.e., immediate-onset repetitive firing) modes, as well as the bistability that underlies discontinuities in first spike latency (FSL) and first interspike interval (FISI). Our reduced model is analyzed in terms of phase plane portraits that vary slowly on the time scale of IKif -inactivation, hf. In addition, considering the large heterogeneity amongst DCN pyramidal cells in the amounts and properties of IKif and IKis, we show how mixtures of IKif and IKis contribute to the discharge patterns. Our fast-slow analysis involves an effective slow inactivation variable whose rate may become much slower during the transient phase of a pattern depending on whether or not IKif has completely inactivated.
4.1 Bistability
Both the KM model and our reduced model show bistability over a range of depolarization current I0 and the slow inactivation variable, when it is treated as a parameter. This bistability between repetitive firing and the steady state plateau associated with the latency explains the sudden break (apparent discontinuity) in the plots of FSL and FISI vs. Ihold. If the latency phase begins outside the bistable regime (hf large enough in the holding state) repetitive firing appears only after hf decreases enough so that the pseudo steady state destabilizes (either FSL or FISI is long). Otherwise, if hf is inside the bistable regime, the strong step depolarizing current will cause the system to jump from the holding state immediately into the coexistent repetitive firing state (short FSL and FISI). The discontinuity in FSL or FISI between the transition from pauser (buildup) to regular firing is because of the overlap of the steady state regime and the repetitive firing regime (bistability). This overlap will occur for a range of both I0 and Ihold. Indeed, Kanold and Manis expressed suspicion that bifurcation phenomena might underlie some discontinuities in FSL and FISI, and they illustrated some dynamic features with phase plane projections (Kanold and Manis 2001). Our analysis provides the mathematical basis for several of these features and phenomena.
Bistability has been seen previously in models with transient potassium current (Rush and Rinzel 1995; Wang 1993; Golomb 2007). Such models would also exhibit discontinuities in FSL and FISI, like those highlighted by KM. Correspondingly, if such discontinuities are found in experiments, we predict that the neuron has an associated underlying bistability. The bistability could be identified by using a brief perturbing current pulse during the later portion of the latency to prematurely initiate repetitive firing. The bistable regime in the KM model is not large and perhaps not large enough in DCN neurons to be directly distinguishable experimentally. But in FS cells the bistability is likely detectable because Golomb’s model has a large range of bistability. Indeed, Golomb showed that noise can dramatically reduce the latency due to the large bistable regime.
This potassium current mediated bistability can also provide the basis for bursting behavior. During the repetitive firing phase, the potassium current may gradually de-inactivate due to strong spike after-hyperpolarization thereby eventually inhibiting firing and then inactivate again during the quiescent period to re-enter the firing phase (Rush and Rinzel 1995; Wang 1993; Golomb 2007). The KM model can also exhibit such bursting with adjustment of some parameters, such as a combined shifting of the inactivation of IKif rightward and increasing gKif (not shown). Similarly, the reduced model can be induced to burst if we introduce a mechanism to increment hf after each spike.
4.2 The leading spike, present or not
Whether a leading spike precedes a long latency after depolarization depends on a permissive biophysical mechanism and on the amplitude and rise time of the depolarizing current. Through dynamical analysis of the KM model and other models with transient potassium currents we have come to understand the mechanism for the long latency before repetitive firing: slow inactivation of a potassium current. We have here unraveled the mechanism that permits a leading spike in the KM-model (and likely in the Golomb model). Activation of IKif proceeds with time constant τmf. If the stimulus induces a fast enough rising membrane potential to outrace mf then a spike will occur. On the other hand, if IKif activation is very fast (say, approximated as instantaneous as in Rush & Rinzel 1995) there is no chance for a leading spike. In this case, there will be no leading spike no matter how large is I0. Thus, the leading spike is a cue for the relative speed of IKif activation mf and the membrane potential. If there is a leading spike the neuron may be signaling that the stimulus onset was very fast (Heil 2004). Since the rise time and the amplitude of excitatory stimuli have influence on the rising speed of membrane potential, the pauser feature is absent if the stimulus is weak or slowly ramped from the pre-pulse hyperpolarization level to the depolarization level. It is also conceivable that a leading spike could serve as a marker point for a target cell or circuit to activate a stopwatch for detecting latency duration.
4.3 Insights from the reduced model
Our reduced model, based on the three currents IKif, Ileak and INa (instantaneous activation with h fixed), mimics key features of the KM subthreshold behavior (latency properties and whether or not there is a leading spike) but surprisingly also some features of the repetitive firing mode.
KM-LIF predicts well the resting potential of the KM model and the membrane potential of the plateau during latency (Fig. 2). We conclude that the three currents determine these two potentials in the KM model. More interesting and harder to understand is that in both the full and reduced models the plateau voltage changes very little even for very strong depolarizing input. The range remains within −55 mV to −40 mV. Recall that in the phase plane of mf vs. V (e.g., Fig. 7), the middle branch of the V-nullcline (dV/dt=0) depends on INa and because mNa, ∞ depends very steeply on V (Fig. 1) the middle branch is nearly vertical. Hence, the voltage of the saddle point can not change much as Ihold or I0 change. Our fast-slow analysis of the KM model and phase plane analysis of KM-LIF showed that the pause ends near the saddle point’s voltage (≈ −40 mV). In addition, the potential at pause initiation (driven by I0) exceeds the resting potential, −60 mV. Therefore, the largest range of the voltage during the pause plateau is from −60 to −40 as in the KM model.
Our phase plane analysis of KM-LIF reveals that a leading spike occurs or not depending on whether the holding state is above or below the threshold separatrix after a step depolarizing current. This threshold feature, by its very nature, depends on the V-mf dynamic interaction. If the depolarizing current develops less abruptly than a step the separatrix is dynamic due to the temporal aspects of I0(t) as well as due to the slowly changing hf; a leading spike may be precluded if the separatrix does not move fast enough to overtake the phase point (V(t), mf(t)) as it moves toward the plateau state. This phase plane interpretation complements our biophysical argument of the preceding subsection. We conjecture that for the KM model and other models/neurons that exhibit a spike at the onset of a transient potassium current-based latency that there is also a dynamic separatrix manifold on the fast time scale for a spike upstroke. Presummably, the leading spike could also show a latency depending on the time course of I0(t). Lastly, if mf is very fast no leading spike will occur. In the phase plane, this follows because the threshold separatrix will be nearly vertical so it cannot overtake the phase point.
Beyond these subthreshold properties we conclude that the dynamic interplay between V and mf underlies bistability in the KM and KM-LIF models. That is, returning to the phase plane portrait of KM-LIF, we recall that for a range of I0 and hf values the plateau potential exists (the depolarized steady state) and simultaneously the post-spike reset point lies suprathreshold to the separatrix (Fig. 6). Thus, the fast subsystem has coexistent attractors: the plateau state and the limit cycle of repetitive firing. If mf is very fast then the reset point always lies subthreshold to the (nearly vertical) separatrix. This observation for KM-LIF suggests that for the KM model bistability also depends on the dynamics of V and mf. Moreover, we predict that if mf is very fast then no bistability occurs and there are no discontinuities in the FSL and FISI plots. We have confirmed (not shown here) these predictions by setting mf = mf, ∞(V). This strong effect of mf dynamics appears to distinguish the KM model from some other models in which bistability occurs even if mf activates instantaneously (Rush and Rinzel 1995; Wang 1993).
4.4 Functional significance of latency before spiking
Transient potassium currents have been quantified for many types of neurons and for non-neuronal cells (Rudy et al. 2010; Goldberg et al. 2008; Yuan & Chen, 2006; and see references in Rudy 1988). Many of these currents activate rapidly and inactivate slowly. In some cells, such as DCN pyramidal cells, elicitation of a transient potassium current requires V to be pre-hyperplarized for a sufficient time to remove inactivation. With substantial hyperpolarization enough potassium current becomes available so that upon depolarization there may be a long latency before repetitive spiking. The latency increases as the duration or amplitude of hyperpolarization increases. In other cells, such as ink motor cells in Aplysia (Byrne 1980 a,b), fast-spiking inter-neurons in cortex (Golomb 2007) and hippocampal neurons (Storm 1988), the transient potassium current is only partially inactivated at rest. Therefore, without pre-hyperpolarization, the neuron may exhibit a long delay before firing. The delay duration usually decreases as the amplitude of the step depolarization increases. Thus, the long latency before regular firing can reflect the inhibition-excitation input balance which has been observed in many recordings, both in vivo and in vitro (Zhang and Oertel 1994; Manis 1990; Rhode and Smith 1983; Smith and Rhode 1985). It is believed for different sensory systems that if several spikes are stimulated, the timing of the first spike following the onset of a stimulus contains a particularly large amount of stimulus-related information (Heil 2004). One may also speculate that a long latency may provide time for evidence-accumulation while a decision is made for a motor plan, say as for ink releasing in the Aplysia californica. The diverse response properties of DCN pyramidal cells suggest that they are very sensitive to the specific complement of excitatory and inhibitory input. Therefore, the transient potassium currents in many neurons provide mechanisms for the cells to encode the timing and amplitude parameters of inhibitory and excitatory inputs through the latency property. A modeling study by Manis (Kanold and Manis 2001) demonstrated how the heterogeneity of such currents in DCN neurons could be used to encode the timing between transient inhibition and excitation events.
4.5 Role of inhibition on firing patterns and encoding of excitatory-inhibitory input
Here we used current injection for hyperpolarizing then depolarizing the neuron models, as in many in vitro and modeling studies (Kanold and Manis 2001). These are non-physiological and idealized representations for synaptic inputs. In some cases the hyperpolarizations were significantly beyond what is achievable by synaptic inhibition which is limited by the synaptic reversal potential (for GABAA/glycine mediated inhibition, the reversal potential is near VCl; GABAB has more negative reversal potential, VK). Nevertheless, from intracellular recordings, both in vivo and in vitro, pauser and buildup firing patterns have been observed without being invoked by direct electrical stimulation to the neuron (Zhang and Oertel 1994; Manis 1990; Rhode and Smith 1986; Smith and Rhode 1985). Under a short tone burst at characteristic frequency, most of fusiform/pyramidal cells exhibited a small membrane depolarization which usually was followed by a long-lasting after-stimulus hyperpolarization (Rhode and Smith 1986). After-stimulus hyperpolarization, however, could also happen without an obvious preceding depolarization and strong excitation (Ding and Voigt 1997). The long-lasting hyperpolarization may reduce the response to the next brief tone stimulus and induce a pauser or buildup pattern. In an interesting study, Kanold and Manis found that even brief inhibition could induce a latency that depended on the duration of an IPSG (or IPSC) train evoked by parallel fiber stimulation (Kanold and Manis 2005) and that inactivation is further removed by short trains of IPSPs. They proposed that the latency could be a mechanism for encoding the relative timing between excitatory-inhibitory inputs and their durations. There could also be a contribution from neuromodulators in vivo that could alter the parameter conditions for hf, ∞, that is, a right-shifted inactivation function would mean less hyperpolarization is required for extended latency.
4.6 Multiple transient potassium currents
We have shown that the presence of two transient potassium currents with similar activation gating but with different inactivation gating properties (the slower component inactivates at more depolarized levels) permits, through mixing their relative strengths, a larger dynamic range for the neuron to regulate the latency to repetitive firing. We presented a framework with which dynamic consequences may be understood and predicted with fast/slow analysis in terms of an effective inactivation gating variable. This enabled us to identify which parameter regimes lead to latency-control by which current and which parameter regimes induce bistability. Our considerations of a mixture were confined to percentage of the total conductance for these transient currents. Flexibility in the absolute amounts would lead to an even richer repertoire of patterning. Such flexibility could be embodied in heterogeneity in a population for various computational tasks. This notion was exploited in the scheme for encoding temporal properties of excitatory-inhibitory inputs cited in the preceding paragraph (Kanold & Manis 2005). One could also imagine recruiting cells that turn-on sequentially by way of a range of latencies whose summation would produce ramping activity say for time perception or production.
Fig 11.
Fig A1.
Fig. A2.
Acknowledgments
The research for this study was supported in part for JR, XYM by the National Institutes of Health grant DC008543-01 and for QL, XYM by the National Natural Science Foundation of China grants 10872014, 10702002, 10802012 and 10902001. JR and XYM thank M. Remme and P. Manis for helpful discussions during the course of this work and B. Clark for comments on the manuscript.
References
- Byrne JH. Quantitative Aspects of ionic conductance mechanisms contributing to firing pattern of motor cells mediating inking behavior in Aplysia California. J Neurophysiol. 1980a;43(3):651–668. doi: 10.1152/jn.1980.43.3.651. [DOI] [PubMed] [Google Scholar]
- Byrne JH. Analysis of ionic conductance mechanisms in motor cells mediating inking behavior in Aplysia californica. J Neurophysiol. 1980b;43(3):630–650. doi: 10.1152/jn.1980.43.3.630. [DOI] [PubMed] [Google Scholar]
- Connor JA, Stevens CF. Prediction of repetitive firing behavior from voltage clamp data on an isolated neurone soma. J Physiol. 1971;213:31–53. doi: 10.1113/jphysiol.1971.sp009366. [DOI] [PMC free article] [PubMed] [Google Scholar]
- Connor JA, Walter D, McKown R. Neural repetitive firing, Modifications of the Hodgkin-Huxley axon suggested by experimental results from crustacean axons. Biophys J. 1977;18:81–102. doi: 10.1016/S0006-3495(77)85598-7. [DOI] [PMC free article] [PubMed] [Google Scholar]
- Davis KA, Young ED. Pharmacological evidence of inhibitory and disinhibitory neuronal circuits in dorsal cochlear nucleus. J Neurophysiol. 2000;83:926–940. doi: 10.1152/jn.2000.83.2.926. [DOI] [PubMed] [Google Scholar]
- Ding J, Benson TE, Voigt HF. Acoustic and current-pulse responses of identified neurons in the dorsal cochlear nucleus of unanesthetized, decerebrate gerbils. J neurophysiol. 1999;82:3434–3457. doi: 10.1152/jn.1999.82.6.3434. [DOI] [PubMed] [Google Scholar]
- Dodla R, Svirskis G, Rinzel J. Well-timed, brief inhibition can promote spiking: postinhibitory facilitation. J Neurophysiol. 2006;95:2664–2677. doi: 10.1152/jn.00752.2005. [DOI] [PMC free article] [PubMed] [Google Scholar]
- Ermentrout B. Simulating, analyzing, and animating dynamical systems: A guide to XPPAUT for researchers and students (software, environment, tools) Philadelphia: Society for Industrial and Applied Mathematics; 2002. [Google Scholar]
- Goldberg EM, Clark BD, Zagha E, Nahmani M, Erisir A, Rudy B. K+ channels at the axon initial segment dampen near-threshold excitability of neocortical fast-spiking GABAergic Interneurons. Neuron. 2008;58:387–400. doi: 10.1016/j.neuron.2008.03.003. [DOI] [PMC free article] [PubMed] [Google Scholar]
- Godfrey DA, Kiang NY, Norris BE. Single unit activity in the dorsal cochlear nucleus of the cat. J Comp Neurol. 1975;162:269–284. doi: 10.1002/cne.901620207. [DOI] [PubMed] [Google Scholar]
- Golomb D, Donner K, Shacham L, Shiosberg D, Amital Y, Hansel D. PLos Comp Biol. 2007;3:1498–1512. doi: 10.1371/journal.pcbi.0030156. [DOI] [PMC free article] [PubMed] [Google Scholar]
- Kanold PO, Manis PB. A physiologically based model of discharge pattern regulation by transient K currents in cochlear nucleus pyramidal cells. J Neurophysiol. 2001;85:523–538. doi: 10.1152/jn.2001.85.2.523. [DOI] [PubMed] [Google Scholar]
- Kanold PO, Manis PB. Encoding the timing of inhibitory inputs. J Neurophysiol. 2005;93:2887–2897. doi: 10.1152/jn.00910.2004. [DOI] [PubMed] [Google Scholar]
- Manis PB. Membrane properties and discharge characteristics of guinea pig dorsal cochlear nucleus neurons studied in vitro. J Neurosci. 1990;10:2338–2351. doi: 10.1523/JNEUROSCI.10-07-02338.1990. [DOI] [PMC free article] [PubMed] [Google Scholar]
- Rhode WS, Smith PH, Oertel D. Physiological response properties of cells labeled intracellularly with horseradish peroxidase in cat dorsal cochlear nucleus. J comparative neurol. 1983;213:426–447. doi: 10.1002/cne.902130407. [DOI] [PubMed] [Google Scholar]
- Oertel D, Young ED. What’s a cerebellar circuit doing in the auditory system? TINS. 2004;27:104–110. doi: 10.1016/j.tins.2003.12.001. [DOI] [PubMed] [Google Scholar]
- Rogawsky MA. The A-current: how ubiquitous a feature of excitable cells is it? TINS. 1985 May;:214–219. [Google Scholar]
- Rothman J, Manis PB. The roles potassium currents play in regulating the electrical activity of ventral cochlear nucleus neurons. J Neurophysiol. 2003;89:3097–3113. doi: 10.1152/jn.00127.2002. [DOI] [PubMed] [Google Scholar]
- Rudy B. Diversity and ubiquity of K channels. Neuroscience. 1988;25:729–749. doi: 10.1016/0306-4522(88)90033-4. [DOI] [PubMed] [Google Scholar]
- Rudy B, Maffie J, Amarillo Y, Clark B, Goldberg EM, Jeong H-Y, Kruglikov I, Kwon E, Nadal M, Zagha E. Voltage gated potassium channels: Structure and function of Kv1 to Kv9 subfamilies. In: Squire LR, editor. Encyclopedia of Neuroscience. Vol. 10. Oxford: Academic Press; 2009. pp. 397–425. [Google Scholar]
- Rush ME, Rinzel J. The potassium A-current, low firing rates and rebound excitation in hodgin-huxley models. Bulletin of mathematical biology. 1995;57:899–929. doi: 10.1007/BF02458299. [DOI] [PubMed] [Google Scholar]
- Storm JF. Temporal integration by a slowly inactivating K current in hippocampal neurons. Nature. 1988;336:379–381. doi: 10.1038/336379a0. [DOI] [PubMed] [Google Scholar]
- Wang XJ. Ionic basis for intrinsic 40 Hz neuronal oscillations. Comp Neurosci. 1993;5:221–224. doi: 10.1097/00001756-199312000-00008. [DOI] [PubMed] [Google Scholar]
- Yuan LL, Chen X. Diversity of potassium channels in neuronal dendrites. Prog in Neurobiology. 2006;78:374–389. doi: 10.1016/j.pneurobio.2006.03.003. [DOI] [PubMed] [Google Scholar]


