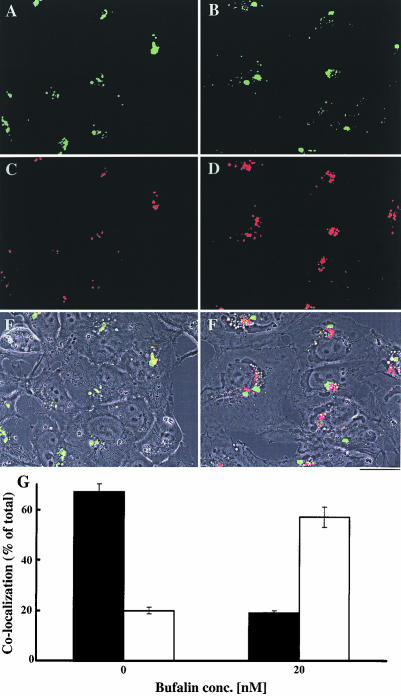
Figure 4.
Most of the transferrin accumulated in bufalin-treated cells is not associated with LDL. The effect of bufalin on the colocalization of transferrin and LDL was determined as described in Figure 4, except that the two ligands were added simultaneously. The control cells are shown in A, C, and E, and the bufalin-treated cells are shown in B, D, and F. The green color (A and B) corresponds to LDL signals, the red (C and E) to transferrin signals, and the yellow (E and F) represents colocalization of the two. Images A-D depict fluorescence signals, and E and F are merged images of phase contrast and the two fluorescence signals. Bar, 20 μm. Colocalization of transferrin with LDL (G) was quantified by measuring the areas occupied by the yellow color (E and F) and calculated as the ratio between the areas of the yellow and the red signals (C and D). The fraction of transferrin colocalized with LDL (solid bars) and dissociated from LDL (white bars) in the control and in the 20 nM bufalin-treated cells is shown.

