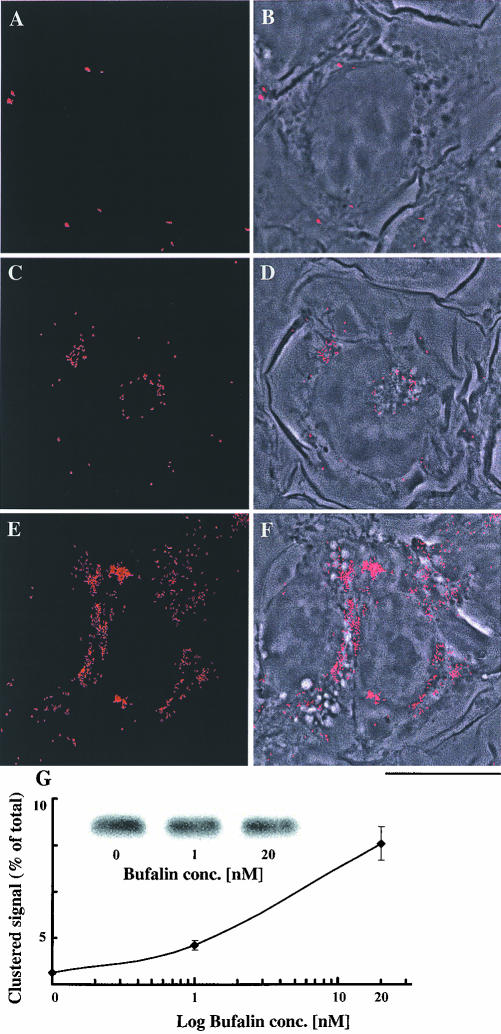
Figure 5.
Bufalin-induced perinuclear clustering of transferrin receptor in NT2 cells. NT2 cells were grown in DMEM-F12 on glass coverslips for 24 h. The DMEM-F12 was then replaced with medium with (C-F) or without (A and B) bufalin for 4.5 h. The cells were fixed and stained with anti-transferrin receptor monoclonal antibodies, and images were acquired by fluorescence microscopy (A, C, and E) as described in MATERIALS AND METHODS. The merged phase contrast and fluorescence images are depicted in B, D, and F. Bar, 10 μm. Quantification of the distribution of the transferrin receptor is shown in G. For this purpose, the average fluorescence intensity of the clustered area of a cell was divided by the average fluorescence intensity of the entire cell and multiplied by 100, yielding the percentage of clustered receptors. The points on the graph (average value ± SD) were derived by analyzing 70-100 cells per point. The experiments were repeated three times. Total cellular transferrin receptor (G) was assessed by Western blot and quantified by densitometry.

