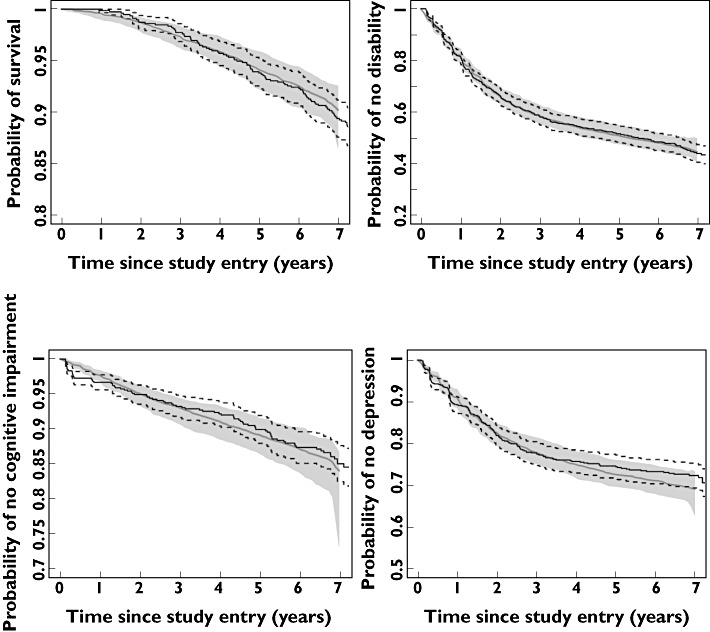
Figure 3.

Kaplan–Meier estimates of observed time to event data (solid lines) and associated 90% confidence intervals (dotted lines), overlaid with parametric model predictions of the base models (dashed lines) and their 90% confidence intervals (gray bands)
