
Figure 3.
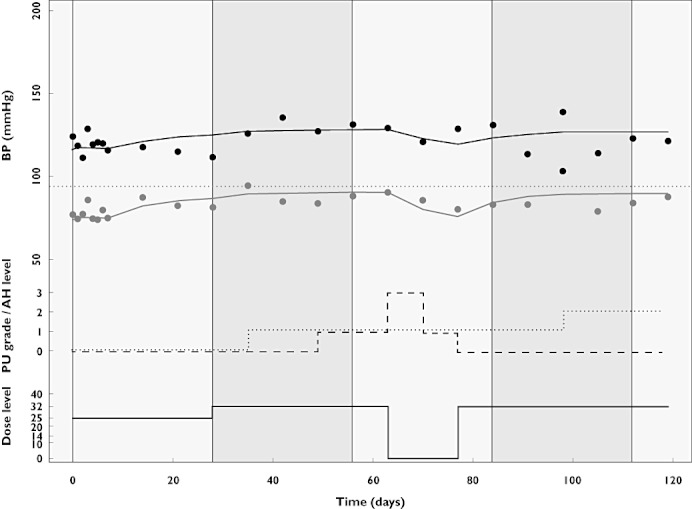
Simulated profile of BP (upper part), proteinuria (PU) toxicity levels (dashed line), dose level (solid line) and AH levels (dotted line) for a typical patient
Official websites use .gov
A
.gov website belongs to an official
government organization in the United States.
Secure .gov websites use HTTPS
A lock (
) or https:// means you've safely
connected to the .gov website. Share sensitive
information only on official, secure websites.
Simulated profile of BP (upper part), proteinuria (PU) toxicity levels (dashed line), dose level (solid line) and AH levels (dotted line) for a typical patient