
Figure 5.
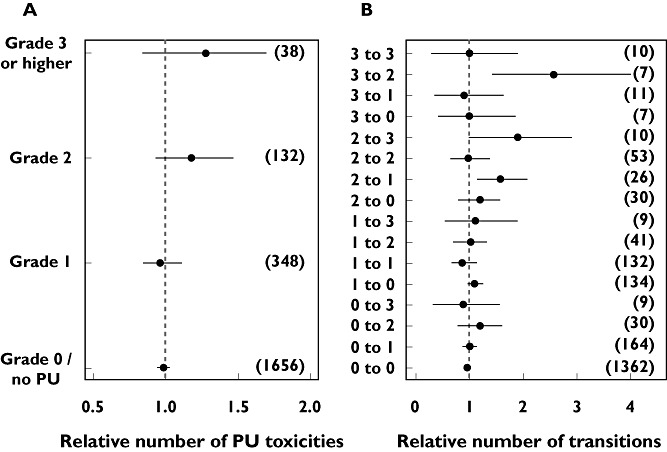
Numerical predictive checks of the number of proteinuria (PU) toxicities and the number of transitions from one grate to another, both relative to the respective observed numbers. Dots present median number of 200 simulations and the lines indicate the 95% confidence interval. The observed number of toxicities/transitions is shown between brackets