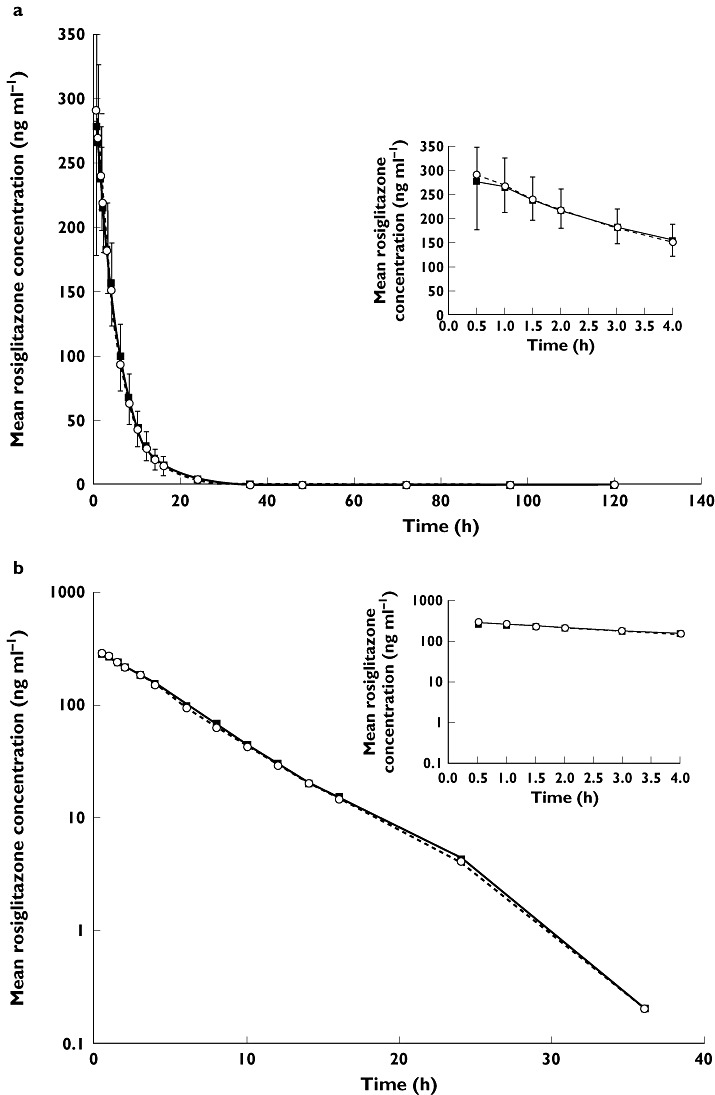
Figure 1.

Mean rosiglitazone plasma concentration–time profiles following a single 4 mg dose of rosiglitazone co-administered with 120 mg febuxostat or matching placebo; linear (a) and logarithmic plots (b). Error bars represent SD; upper bars, febuxostat phase, and lower bars, placebo phase. Rosiglitazone + Febuxostat ( ); Rosiglitazone + Placebo (
 )
)
