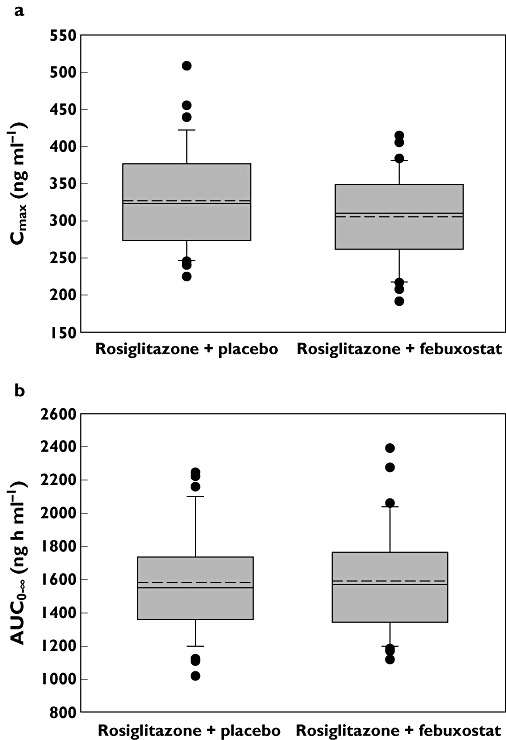
Figure 3.

Box plots of rosiglitazone Cmax(a) and AUC0–∞ (b) following administration of a single 4 mg dose of rosiglitazone co-administered with febuxostat 120 mg or matching placebo. The upper and lower boundaries of the box represent the 75th and 25th percentiles, respectively. This continuous line within the box marks the mean and the dashed line marks the median. Error bars indicated the 90th and 10th percentiles. Filled circles represent all data points outside the 90th to 10th percentiles
