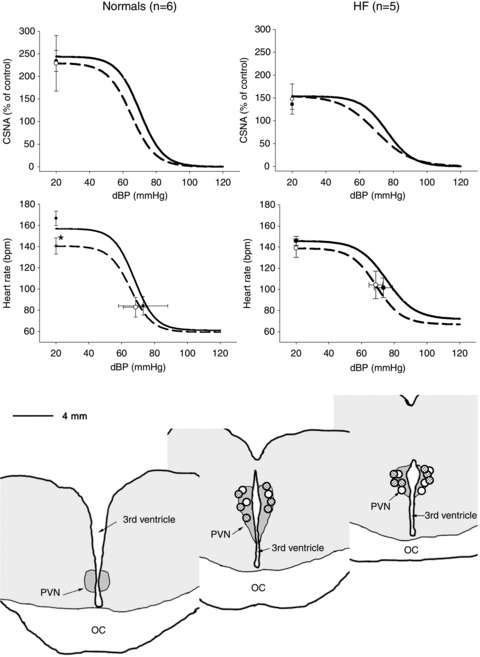
Figure 2. Arterial baroreflex curves for cardiac SNA and heart rate (HR) during the control period (continuous line, filled circles) and after microinjection of glycine (1 mm) (dashed line, open circles) in normal and HF sheep.

CSNA is presented as percentage of baseline activity measured. Resting points were taken from 5 min of recording during control periods. Values are means ± SEM (n= 6 in the normal and n= 5 in the HF group). The bottom panel indicates the distribution of microinjection sites in normal and HF sheep, dots show centre of injection sites as visualized by the distribution of blue dye in the normal (open circles) and heart failure animals. OC, optic chiasm.
